Land Resources
Land is a finite resource and put to many competing uses. Agriculture, forestry industries, transport, housing and other services use land as a natural and/or an economic resource. Land is also an integral part of ecosystems and indispensable for biodiversity and the carbon cycle.
Land can be divided into two interlinked concepts:
1. Land cover refers to the bio-physical coverage of land (for example, crops, grass, broad-leaved forest, or built-up area);
2. Land use indicates the socio-economic use of land (for example, agriculture forestry, recreation or resk1entialbse).
Land cover and land use data forms the basis for spatial and territorial analysis which are increasingly important for:
1. the planning and management of agricultural, forest, wetland, Water and urban areas.
2. Nature, biodiversity and soil protection, and;
3. The prevention and mitigation of natural hazards and climate change.
The land-use categories
The land-use categories as maintained in the Land Revenue Records are as follows:
- Forests: It is important to note that area under actual forest cover is different from area classified as forest. The latter is the area which the Government has identified and demarcated for forest growth. The land revenue records are consistent with the latter definition. Thus, there may be an increase in this category without any increase in the actual forest cover.
- Land put to Non-agricultural Uses: Land under settlements (rural and urban), infrastructure (roads, canals, etc.), industries, shops, etc. are included in this category. An expansion in the secondary and tertiary activities would lead to an increase in this category of land-use.
- Barren and Wastelands: The land which may be classified as a wasteland such as barren hilly terrains, desert lands, ravines, etc. normally cannot be brought under cultivation with the available technology.
- Area under Permanent Pastures and Grazing Lands: Most of this type land is owned by the village ‘Panchayat’ or the Government. Only a small proportion of this land is privately owned. The land owned by the village panchayat comes under ‘Common Property Resources’.
- Area under Miscellaneous Tree Crops and Groves (Not included is Net sown Area) : The land under orchards and fruit trees are included in this category. Much of this land is privately owned.
- Culturable Waste-Land : Any land which is left fallow (uncultivated) for more than five years is included in this category. It can be brought under cultivation after improving it through reclamation practices.
- Current Fallow : This is the land which is left without cultivation for one or less than one agricultural year. Fallowing is a cultural practice adopted for giving the land rest. The land recoups the lost fertility through natural processes.
- Fallow other than Current Fallow : This is also a cultivable land which is left uncultivated for more than a year but less than five years. If the land is left uncultivated for more than five years, it would be categorised as culturable wasteland.
- Net Area Sown: The physical extent of land on which crops are sown and harvested is known as net sown area.
Land Usage Pattern In India
- Net Sown Area
- It is the total absolute value of the area cropped. This means that even if the same land is cropped multiple times each year, it will be counted only once.
- 05% is the Net Sown Area in India
- It is about 142 million hectares (Total land area of India is ~328 million hectares)
- Cropped More Than Once
- About 40% of Net Sown Area
- ~57 million hectare
- Rapid increase in last decade
- This is the only course left to drastically increase production
- Indo-Ganga plains is the leader in this regard
- Forest Area
- 23% of reported area notified as forest area
- For tropical country, 33% is ideal coverage
- Madhya Pradesh has largest forest area
- Mizoram has highest percentage of area under forest
- Punjab, Delhi, UP and Bihar lag behind
- Forest Area was 14% in 1950-51
- Not Available for Cultivation
- a) Land put to non-agricultural use
- Housing, industry, roads, lakes etc.
- b)Barren Unculturable Wasteand
- Mountains, hill slopes etc.
- About 14% land falls under this category
- Mostly due to prohibitive input cost
- Largest area in Andhra Pradesh>Rajasthan>Himachal Pradesh
- a) Land put to non-agricultural use
- Permanent Pastures
- About 3.5% of reported area
- Continually decreasing
- 1/3 of all pastures in Himachal Pradesh alone
- Fallow Land
- a) Current Fallow (upto 1 year)
- b) Fallow other than Current Fallow (1-5 years)
- About 8% area under fallow. This is done to recoup the fertility levels of land
- Tree crops and Groves
- This is continually decreasing
- Only ~1% land
- Culturable Wasteland
- Land available for agriculture but not utilized for various reasons
- Saline soil, e.g. Reh/Bhur/Usar in UP/Haryana/Punjab
- Faulty agricultural practices
- 5% of total area
- Rajasthan alone has 36% of such wasteland
It is important to memorize the above basic data and information about Land Usage Pattern in India. There can be direct question asking you to list out the land usage pattern in India. Sometimes they may ask related question where you can use this information to add value to your answers.
Land-use Changes in India
Land-use in a region, to a large extent, is influenced by the nature of economic activities carried out in that region. However, while economic activities change over time, land, like many other natural resources, is fixed in terms of its area.
At this stage, one needs to appreciate three types of changes that an economy undergoes, which affect land-use.
- The size of the economy (measured in terms of value for all the goods and services produced in the economy) grows over time as a result of increasing population, change in income levels, available technology and associated factors. As a result, the pressure on land will increase with time and marginal lands would come under use.
- Secondly, the composition of the economy would undergo a change over time. In other words, the secondary and the tertiary sectors usually grow much faster than the primary sector, specifically the agricultural sector. This type of change is common in developing countries like India. This process would result in a gradual shift of land from agricultural uses to non-agricultural uses. You would observe that such changes are sharp around large urban areas. The agricultural land is being used for building purposes.
- Thirdly, though the contribution of the agricultural activities reduces over time, the pressure on land for agricultural activities does not decline. The reasons for continued pressure on agricultural land are:
(a) In developing countries, the share of population dependent on agriculture usually declines much more slowly compared to the decline in the sector’s share in GDP.
(b) The number of people that the agricultural sector has to feed is increasing day by day.
India has undergone major changes within the economy over the past four or five decades, and this has influenced the land-use changes in the country.
Following are the changes increased:
- The rate of increase is the highest in case of area under non-agricultural uses. This is due to the changing structure of Indian economy, which is increasingly depending on the contribution from industrial and services sectors and expansion of related infrastructural facilities. Also, an expansion of area under both urban and rural settlements has added to the increase. Thus, the area under non-agricultural uses is increasing at the expense of wastelands and agricultural land.
- The increase in the share under forest, as explained before, can be accounted for by increase in the demarcated area under forest rather than an actual increase in the forest cover in the country.
- The increase in the current fallow cannot be explained from information pertaining to only two points. The trend of current fallow fluctuates a great deal over years, depending on the variability of rainfall and cropping cycles.
- The increase in net area sown is a recent phenomenon due to use of culturable waste land for agricultural purpose. Before which it was registering a slow decrease. There are indications that most of the decline had occurred due to the increases in area under non agricultural use.
The four categories that have registered a decline are barren and wasteland, culturable wasteland, area under pastures and tree crops and fallow lands. The following explanations can be given for the declining trends:
- As the pressure on land increased, both from the agricultural and non agricultural sectors, the wastelands and culturable wastelands have witnessed decline over time.
- The decline in land under pastures and grazing lands can be explained by pressure from agricultural land. Illegal encroachment due to expansion of cultivation on common pasture lands is largely responsible for this decline.
Land Reforms in India
Under the 1949 Indian constitution, states were granted the powers to enact (and implement) land reforms. This autonomy ensures that there has been significant variation across states and time in terms of the number and types of land reforms that have been enacted. We classify land reform acts into four main categories according to their main purpose.
- The first category is acts related to tenancy reform. These include attempts to regulate tenancy contracts both via registration and stipulation of contractual terms, such as shares in share tenancy contracts, as well as attempts to abolish tenancy and transfer ownership to tenants.
- The second category of land reform acts is attempts to abolish intermediaries. These intermediaries who worked under feudal lords (Zamandari) to collect rent for the British were reputed to allow a larger share of the surplus from the land to be extracted from tenants. Most states had passed legislation to abolish intermediaries prior to 1958.
- The third category of land reform acts concerned efforts to implement ceilings on land holdings, with a view to redistributing surplus land to the landless.
- Finally, we have acts which attempted to allow consolidation of disparate land-holdings.’ Though these reforms and in particular the latter were justified partly in terms of achieving efficiency gains in agriculture it is clear from the acts themselves and from the political manifestos supporting the acts that the main impetus driving the first three reforms was poverty reduction.
Existing assessments of the effectiveness of these different reforms are highly mixed. Though promoted by the centre in various Five Year Plans, the fact that land reforms were a state subject under the 1949 Constitution meant that enactment and implementation was dependent on the political will of state governments. The perceived oppressive character of the Zamandari and their close alliance with the British galvanized broad political support for the abolition intermediaries and led to widespread implementation of these reforms most of which were complete by the early 1960s. Centre-state alignment on the issue of tenancy reforms was much less pronounced. With many state legislatures controlled by the landlord class, reforms which harmed this class tended to be blocked, though where tenants had substantial political representation notable successes in implementation were recorded.
Despite the considerable publicity attached to their enactment, political failure to implement was most complete in the case of land ceiling legislation. Here ambivalence in the formulation of policy and numerous loopholes allowed the bulk of landowners to avoid expropriation by distributing surplus land to relations, friends and dependents. As a result of these problems, implementation of both tenancy reform and land ceiling legislation tended to lag well behind the targets set in the Five Year Plans. Land consolidation legislation was enacted less than the other reforms and, owing partly to the sparseness of land records, implementation has been considered to be both sporadic and patchy only affecting a few states in any significant way. Village level studies also offer a very mixed assessment of the poverty impact of different land reforms. Similar reforms seemed to have produced different effects in different areas leaving overall impact indeterminate. There is some consensus that the abolition of intermediaries achieved a limited and variable success both in redistributing land towards the poor and increasing the security of smallholders.
For tenancy reform, however, whereas successes have been recorded, in particular, where tenants are well organized there has also been a range of documented cases of imminent legislation prompting landlords to engage in mass evictions of tenants and of the de jure banning of landlord-tenant relationships pushing tenancy under- ground and therefore, paradoxically, reducing tenurial security. Land ceiling legislation, in a variety of village studies, is also perceived to have had neutral or negative effects on poverty by inducing landowners from joint families to evict their tenants and to separate their holdings into smaller proprietary units among family members as a means of avoiding expropriation. Land consolidation is also on the whole judged not to have been progressive in its redistributive impact given that richer farmers tend to use their power to obtain improved holdings. There is a considerable variation in overall land reform activity across states with states such as Uttar Pradesh, Kerala and Tamil Nadu having a lot of activity while Punjab and Rajasthan have very little.
National Land Records Modernization Programme (NLRMP):
• It was launched by the Government in 2008, aimed ta modernize management of land records, minimize scope of land property disputes, enhance transparency in the land records maintenance system, and facilitate moving eventually towards guaranteed conclusive titles to immovable properties in the country.
• the activities to be supported under the Programme, inter alia, include survey using modern technology including aerial photogrammetry updating of land records including mutation records, completion of computerization of the records of rights (RoRs). Computerization of registration, automatic generation of mutation notices, digitization of maps, integration of the entire system digitization of maps and training and capacity building of the concerned officials and functionaries.
Land Degradation Problem
One of the serious problems that arise out of faulty strategy of irrigation and agricultural development is degradation of land resources. This is serious because it may lead to depletion of soil fertility. The situation is particularly alarming in irrigated areas. A large tract of agricultural land has lost its fertility due to alkalisation and salinisation of soils and water logging. Alkalinity and salinity have already affected about 8 million ha land. Another 7 million ha land in the country has lost its fertility due to water logging. Excessive use of chemicals such as insecticides and pesticides has led to their concentration in toxic amounts in the soil profile. Leguminous crops have been displaced from the cropping pattern in the irrigated areas and duration of fallow has substantially reduced owing to multiple cropping. This has obliterated the process of natural fertilization such as nitrogen fixation. Rainfed areas in humid and semi-arid tropics also experience degradation of several types like soil erosion by water and wind erosion which are often induced by human activities.
UN Convention to Combat Desertification: COP 14
The 14th edition of the Conference of Parties (COP-14) to the UN Convention to Combat Desertification (UNCCD) ended on 13th September 2019.
- Held in Greater Noida, this was the first time that India hostedan edition of the UNCCD COP.
- The themeof the Conference was ‘Restore land, Sustain future’.
- India being the global host for COP 14has taken over the COP Presidency from China for the next two years till 2021.
- India is among the select few countries to have hosted the COP of all three Rio conventionson climate change, biodiversity and land.
Key Takeaways
- Delhi Declaration:Commitment for a range of issues, including gender and health, ecosystem restoration, taking action on climate change, private sector engagement, Peace Forest Initiative and recovery of five million hectares of degraded land in India.
- The country parties have agreed to make the Sustainable Development Goal target of achieving land degradation neutrality by 2030,a national target for action.
- Peace Forest Initiative:It is an initiative of South Korea to use ecological restoration as a peace-building process. It aims at addressing the issue of land degradation in conflict-torn border areas and would go a long way in alleviating tensions and building trust between communities living there and between enemy countries in particular.
- Drought Toolbox:It is launched as a one-stop-shop for all actions on drought. It is a sort of knowledge bank which contains tools that strengthen the ability of countries to anticipate and prepare for drought effectively and mitigate their impacts as well as tools that enable communities to anticipate and find the land management tools that help them to build resilience to drought.
- International coalition for action on Sand and Dust storms (SDS):The coalition will develop an SDS source base map with the goal of improving monitoring and response to these storms. SDS affects approximately 77% of UNCCD country Parties or approximately 151 countries.
- Initiative of Sustainability, Stability and Security (3S):Launched by 14 African countries to address migration driven by land degradation. It aims at restoring land and creating green jobs for migrants and vulnerable groups.
- Cooperation From Youth:The global Youth Caucus on Desertification and Land convened its first official gathering in conjunction with the UNCCD COP14 to bring together youth advocates from different parts of the world, to build their capacity, share knowledge, build networks and to engage them meaningfully in the UNCCD processes.
High-Level Segment Meeting of the COP14
- The Prime Minister of India inaugurated and addressed the high-level segment meeting of the COP-14.
- India seeks to propose initiatives for greater South-South cooperationin addressing issues of climate change, biodiversity and land degradation.
- India would raise its ambition of the total area that would be restored from its land degradation status, from twenty-one million hectares to twenty-six million hectares between now and 2030.
- India has proposed to set up a global technical support institutefor the member countries of the UNCCD for their capacity building and support regarding the Land Degradation Neutrality Target Setting Program.
- India called upon the leadership of UNCCD to conceive a global water action agenda which is central to the Land Degradation Neutrality strategy.
- India advocated on the need to eradicate the menace of single-use plastic.
.
Water Resources
India accounts for about 2.45 per cent of world’s surface area, 4 per cent of the world’s water resources and about 16 per cent of world’s population. The total water available from
precipitation in the country in a year is about 4,000 cubic km. The availability from surface water and replenishable groundwater is 1,869 cubic km. Out of this only 60 per cent can be
put to beneficial uses. Thus, the total utilisable water resource in the country is only 1,122 cubic km.
Surface Water Resources
There are four major sources of surface water. These are rivers, lakes, ponds, and tanks. In the country, there are about 10,360 rivers and their tributaries longer than 1.6 km each. The mean annual flow in all the river basins in India is estimated to be 1,869 cubic km.
However, due to topographical, hydrological and other constraints, only about 690 cubic km (32 per cent) of the available surface water can be utilised. Water flow in a river depends on size of its catchment area or river basin and rainfall within its catchment area. Precipitation is relatively high in the catchment areas of the Ganga, the Brahmaputra and the Barak rivers, these rivers, although account for only about one-third of the total area in the country, have 60 per cent of the total surface water resources. Much of the annual water flow in south Indian rivers like the Godavari, the Krishna, and the Kaveri has been harnessed, but it is yet to be done in the Brahmaputra and the Ganga basins.
Groundwater Resources
The total replenishable groundwater resources in the country are about 432 cubic km. Table shows that the Ganga and the Brahmaputra basins, have about 46 per cent of the total replenishable groundwater resources.
|
Name of Basin |
Total Replenishable |
Level of Groundwater |
|
1. Brahmani with Baitarni |
4.05 |
8.45 |
|
2. Brahmaputra |
26.55 |
3.37 |
|
3. Chambal Composite |
7.19 |
40.09 |
|
4. Kaveri |
12.3 |
55.33 |
|
5. Ganga |
170.99 |
33.52 |
|
6. Godavari |
40.65 |
19.53 |
|
7. Indus |
26.49 |
77.71 |
|
8. Krishna |
26.41 |
30.39 |
|
9. K and S Luni |
11.23 |
51.14 |
|
10. Chennai and S. TN |
18.22 |
57.68 |
|
11. Mahanadi |
16.46 |
6.95 |
|
12. Meghna |
8.52 |
3.94 |
|
13. Narmada |
10.83 |
21.74 |
|
14. Northeast Composite |
18.84 |
17.2 |
|
15. Pennar |
4.93 |
36.6 |
|
16. Subarnrekha |
1.82 |
9.57 |
|
17. Tapi |
8.27 |
33.05 |
|
18. Western Ghat |
17.69 |
22.88 |
|
Total |
431.42 |
31.97 |
|
Source: NCERT |
||

The level of groundwater utilisation is relatively high in the river basins lying in north-western region and parts of south India. The groundwater utilisation is very high in the states of Punjab, Haryana, Rajasthan, and Tamil Nadu. However, there are States like Chhattisgarh, Odisha, Kerala, etc., which utilise only a small proportion of their groundwater potentials. States like Gujarat, Uttar Pradesh, Bihar, Tripura and Maharashtra are utilising their ground water resources at a moderate rate. If the present trend continues, the demands for water would need the supplies. And such situation, will be detrimental to development, and can cause social upheaval and disruptions.
Lagoons and Backwaters
India has a vast coastline and the coast is very indented in some states. Due to this, a number of lagoons and lakes have formed. The States like Kerala, Odisha and West Bengal have vast surface water resources in these lagoons and lakes. Although, water is generally brackish in these water-bodies, it is used for fishing and irrigating certain varieties of paddy crops, coconut, etc.
Water Demand and Utilisation
India has traditionally been an agrarian economy, and about two-third of its population have been dependent on agriculture. Hence, development of irrigation to increase agricultural production has been assigned a very high priority in the Five Year Plans, and multipurpose river valleys projects like the Bhakra-Nangal, Hirakud, Damodar Valley, Nagarjuna Sagar, Indira Gandhi Canal Project, etc. have been taken up. In fact, India’s water demand at present is dominated by irrigational needs. As shown in Fig. 6.2 and 6.3, agriculture accounts for most of the surface and ground water utilisation, it accounts for 89 per cent of the surface water and 92 per cent of the groundwater utilisation. While the share of industrial sector is limited to 2 per cent of the surface water utilisation and 5 per cent of the ground-water, the share of domestic sector is higher (9 per cent) in surface water utilisation as compared to groundwater. The share of agricultural sector in total water utilisation is much higher than other sectors. However, in future, with development, the shares of industrial and domestic sectors in the country are likely to increase.
Annual precipitation in India, including snowfall, which is the main source of water, is about 4000 bcm. About 53.3 per cent of the total precipitation is lost due to evapo-transpiration, which leaves a balance of 1869 bcm water in the country. Of this, the available utilizable water resource potential is 1137 bcm, comprising 690 bcm of surface water and 447 bcm of ground water.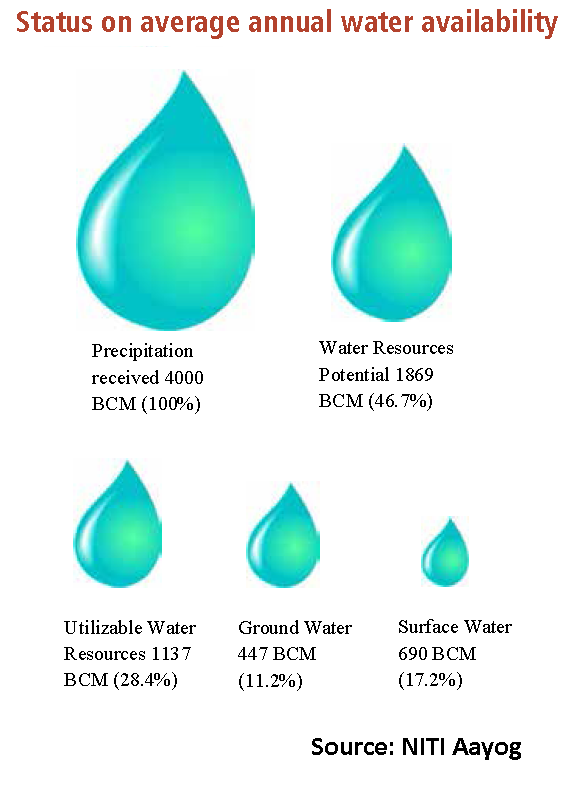
According to the Water and Related Statistics published by the Central Water Commission, per capita annual water availability in the country has decreased from 1816 cubic metres (cu m) in 2001 to 1544 cum in 2011. As per the Falkenmark Index, one of the most commonly used measures of water scarcity, if the amount of renewable water in a country is below 1,700 cu m per person per year, the country is said to be experiencing water stress; below 1000 cu m it is said to be experiencing water scarcity. The National Commission for Integrated Water Resources Development (NCIWRD) has projected the total demand for water at 1,180 bcm for a high demand scenario.
Water resources are facing pressure due to population explosion, urbanization, rising demand for water from the agriculture, energy, and industry sectors, pollution, inefficient use, poor management and poor institutional mechanisms. Several regions experience water scarcity due to the uneven distribution of water resources over space and time.
The government has specific programmes for various aspects of water resources. The scheme, Pradhan Mantri Krishi Sinchayee Yojana (PMKSY), which is an umbrella scheme for irrigation has prioritized 99 major and medium irrigation projects for completion by December 2019. The government also launched the “Namami Gange” scheme in 2014-15 to clean and rejuvenate the River Ganga to maintain “Aviral” and “Nirmal Dhara” and ensure its ecological and geological integrity. Data for the period 2015-17 indicates improvement in water quality in terms of dissolved oxygen and coliform bacteria. However, a lot needs to be done in terms of meeting the targets of sewage treatment plans (STP) and of controlling household and industrial waste. Besides, a scheme for groundwater development and management to prepare aquifer management plans and facilitate sustainable management of groundwater has been launched.
Constraints
1. There is a huge gap between the irrigation
potential created (112.5 million ha in 2012) and
the irrigation potential utilized (89.3 million ha
in 2012). Apart from the underutilization of the
potential, the efficiency of the irrigation systems
is low at 30 per cent to 38 per cent for surface
water and 55 per cent for ground water.
2. Despite clear evidence of rising water
stress, water is still used inefficiently and
indiscriminately, particularly in agriculture. Poor
implementation and maintenance of projects,
absence of participatory irrigation management,
non-alignment of cropping patterns to the agroclimatic
zones, and absence of field channels
(CAD works) are some of the challenges.
3. The Easement Act, 1882, which grants
groundwater ownership rights to the landowner
is one of the reasons for water over-use and
depletion of groundwater levels.
4. The subsidized pricing of water in various states
has resulted in non-revenue water and a sharp
decline in groundwater levels in all states.
5. As per 2011 Census, only 30.8 per cent of the
total rural households and 70.6 per cent of the
total urban households get piped water supply.
6. The sustainability of the source and growing
contamination of ground water in newer areas
are constraints in ensuring safe drinking water
supply in rural and urban areas.
Demand of Water for Irrigation
In agriculture, water is mainly used for irrigation. Irrigation is needed because of spatio-temporal variability in rainfall in the country. The large tracts of the country are deficient in rainfall and are drought prone. North-western India and Deccan plateau constitute such areas. Winter and summer seasons are more or less dry in most part of the country. Hence, it is difficult to practise agriculture without assured irrigation during dry seasons. Even in the areas of ample rainfall like West Bengal and Bihar, breaks in monsoon or its failure creates dry spells detrimental for agriculture. Water need of certain crops also makes irrigation necessary. For instance, water requirement of rice, sugarcane, jute, etc. is very high which can be met only through irrigation. Provision of irrigation makes multiple cropping possible. It has also been found that irrigated lands have higher agricultural productivity than unirrigated land. Further, the high yielding varieties of crops need regular moisture supply, which is made possible only by a developed irrigation systems. In fact, this is why that green revolution strategy of agriculture development in the country has largely been successful in Punjab, Haryana and western Uttar Pradesh.
In Punjab, Haryana and Western Uttar Pradesh more than 85 per cent of their net sown area is under irrigation. Wheat and rice are grown mainly with the help of irrigation in these states. Of the total net irrigated area 76.1 per cent in Punjab and 51.3 per cent in Haryana are irrigated through wells and tube wells. This shows that these states utilise large proportion of their ground water potential which has resulted in ground water depletion in these states. The share of area irrigated through wells and tube wells is also very high in the states given in table.
|
State |
Percentage |
|
Gujarat |
86.6 |
|
Rajasthan |
77.2 |
|
Madhya Pradesh |
66.5 |
|
Maharashtra |
65 |
|
Uttar Pradesh |
58.21 |
|
West Bengal |
57.6 |
|
Tamil Nadu |
54.7 |
The over-use of ground water resources has led to decline in ground water table in these states. In fact, over withdrawals in some states like Rajasthan and Maharashtra has increased fluoride concentration in ground-water and this practice has led to increase in concentration of arsenic in parts of West Bengal and Bihar.
Emerging Water Problems
The per capita availability of water is dwindling day by day due to increase in population. The available water resources are also getting polluted with industrial, agricultural and domestic effluents, and this, in turn, is further limiting the availability of usable water resources.
Deterioration of Water Quality
Water quality refers to purity of water, or water without unwanted foreign substances. Water gets polluted by foreign matters such as microorganisms, chemicals, industrial and other wastes. Such matters deteriorate the quality of water and render it unfit for human use. When toxic substances enter lakes, streams, rivers, ocean and other water bodies, they get dissolved or lie suspended in water. This results in pollution of water whereby quality of water deteriorates affecting aquatic systems. Sometimes, these pollutants also seep down and pollute groundwater. The Ganga and the Yamuna are the two highly polluted rivers in the country.
Water Conservation and Management
Since there is a declining availability of fresh water and increasing demand, the need has arisen to conserve and effectively manage this precious life giving resource for sustainable development. Given that water availability from sea/ocean, due to high cost of desalinisation, is considered negligible, India has to take quick steps and make effective policies and laws, and adopt effective measures for its conservation. Besides developing water saving technologies and methods, attempts are also to be made to prevent the pollution. There is need to encourage watershed development, rainwater harvesting, water recycling and reuse, and conjunctive use of water for sustaining water supply in long run.
Prevention of Water Pollution
Available water resources are degrading rapidly. The major rivers of the country generally retain better water quality in less densely populated upper stretches in hilly areas. In plains, river water is used intensively for irrigation, drinking, domestic and industrial purposes. The drains carrying agricultural (fertilisers and insecticides), domestic (solid and liquid wastes), and industrial effluents join the rivers. The concentration of pollutants in rivers, especially remains very high during the summer season when flow of water is low. The Central Pollution Control Board (CPCB) in collaboration with State Pollution Control Boards has been monitoring water quality of national aquatic resources at 507 stations. The data obtained from these stations show that organic and bacterial contamination continues to be the main source of pollution in rivers. The Yamuna river is the most polluted river in the country between Delhi and Etawah. Other severely polluted rivers are: the Sabarmati at Ahmedabad, the Gomti at Lucknow, the Kali, the Adyar, the Cooum (entire stretches), the Vaigai at Madurai and the Musi of Hyderabad and the Ganga at Kanpur and Varanasi. Groundwater pollution has occurred due to high concentrations of heavy/toxic metals, fluoride and nitrates at different parts of the country. The legislative provisions such as the Water (Prevention and Control of Pollution) Act 1974, and Environment Protection Act 1986 have not been implemented effectively. The result is that in 1997, 251 polluting industries were located along the rivers and lakes. The Water Cess Act, 1977, meant to reduce pollution has also made marginal impacts. There is a strong need to generate public awareness about importance of water and impacts of water pollution. The public awareness and action can be very effective in reducing the pollutants from agricultural activities, domestic and industrial discharges. Recycle and Reuse of Water Another way through which we can improve fresh water availability is by recycle and reuse. Use of water of lesser quality such as reclaimed waste-water would be an attractive option for industries for cooling and fire fighting to reduce their water cost. Similarly, in urban areas water after bathing and washing utensils can be used for gardening. Water used for washing vehicle can also be used for gardening. This would conserve better quality of water for drinking purposes. Currently, recycling of water is practised on a limited scale. However, there is enormous scope for replenishing water through recycling.
Watershed Management
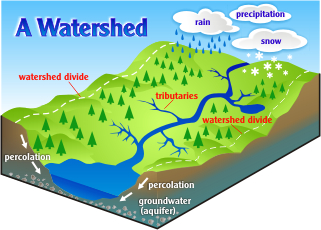
Watershed management basically refers to efficient management and conservation of surface and groundwater resources. It involves prevention of runoff and storage and recharge of groundwater through various methods like percolation tanks, recharge wells, etc. However, in broad sense watershed management includes conservation, regeneration and judicious use of all resources – natural (like land, water, plants and animals) and human with in a watershed. Watershed management aims at bringing about balance between natural resources on the one hand and society on the other. The success of watershed development largely depends upon community participation.
The Central and State Governments have initiated many watershed development and management programmes in the country. Some of these are being implemented by nongovernmental organisations also. Haryali is a watershed development project sponsored by the Central Government which aims at enabling the rural population to conserve water for drinking, irrigation, fisheries and afforestation. The Project is being executed by Gram Panchayats with people’s participation.
Neeru-Meeru (Water and You) programme (in Andhra Pradesh) and Arvary Pani Sansad (in Alwar, Rajasthan) have taken up constructions of various water-harvesting structures such as percolation tanks, dug out ponds (Johad), check dams, etc. through people’s participation. Tamil Nadu has made water harvesting structures in the houses compulsory. No building can be constructed without making structures for water harvesting.
Watershed development projects in some areas have been successful in rejuvenating environment and economy. However, there are only a few success stories. In majority of cases, the programme is still in its nascent stage. There is a need to generate awareness regarding benefits of watershed development and management among people in the country, and through this integrated water resource management approach water availability can be ensured on sustainable basis.
Rainwater Harvesting
Rain water harvesting is a method to capture and store rainwater for various uses. It is also used to recharge groundwater aquifers. It is a low cost and eco-friendly technique for preserving every drop of water by guiding the rain water to bore well, pits and wells. Rainwater harvesting increases water availability, checks the declining ground water table, improves the quality of groundwater through dilution of contaminants like fluoride and nitrates, prevents soil erosion, and flooding and arrests salt water intrusion in coastal areas if used to recharge aquifers. Rainwater harvesting has been practised through various methods by different communities in the country for a long time.
Traditional rain water harvesting in rural areas is done by using surface storage bodies like lakes, ponds, irrigation tanks, etc. In Rajasthan, rainwater harvesting structures locally known as Kund or Tanka (a covered underground tank) are constructed near or in the house or village to store harvested rainwater. There is a wide scope to use rainwater harvesting technique to conserve precious water resource. It can be done by harvesting rainwater on rooftops and open spaces. Harvesting rainwater also decreases the community dependence on groundwater for domestic use. Besides bridging the demand supply gap, it can also save energy to pump groundwater as recharge leads to rise in groundwater table. These days rainwater harvesting is being taken up on massive scale in many states in the country. Urban areas can specially benefit from rainwater harvesting as water demand has already outstripped supply in most of the cities and towns.
Apart from the above mentioned factors, the issue desalinisation of water particularly in coastal areas and brackish water in arid and semi-arid areas, transfer of water from water surplus areas to water deficit areas through inter linking of rivers can be important remedies for solving water problem in India (read more about inter linking of rivers). However, the most important issue from the point of view of individual users, household and communities is pricing of water.
National Water Policy
National Water Policy is formulated by the Ministry of Water Resources of the Government of India to govern the planning and development of water resources and their optimum utilization. The first National Water Policy was adopted in September, 1987. It was reviewed and updated in 2002 and later in 2012.
India accounts for 18% of the world population and about 4% of the world’s water resources. One of the solutions to solve the country’s water woes is to create Indian Rivers Inter-link.
India has been successful in creating live water storage capacity of about 253 billion cubic meter(BCM) so far. In a first, the ecological needs of river have also been taken into consideration.
Salient features
The major provisions under the policy are:
Envisages to establish a standardized national information system with a network of data banks and data bases .
Resource planning and recycling for providing maximum availability.
To give importance to the impact of projects on human settlements and environment.
Guidelines for the safety of storage dams and other water-related structures.
Regulate exploitation of groundwater.
Setting water allocation priorities in the following order: Drinking water, Irrigation, Hydropower, Navigation, Industrial and other uses.
The water rates for surface water and ground water should be rationalized with due regard to the interests of small and marginal farmers.
The policy also deals with participation of farmers and voluntary agencies, water quality, water zoning, conservation of water, flood and drought management, erosion etc.[3]
National Water Policy 2012
The main emphasis of National Water Policy 2012 is to treat water as economic good which the ministry claims to promote its conservation and efficient use.[4] This provision intended for the privatization of water-delivery services is being criticized from various quarters.[5] The policy also does away with the priorities for water allocation mentioned in 1987 and 2002 versions of the policy. The policy was adopted with a disapproval from many states.
Critics
Paradigm shift in approach from service provider of water to facilitator of service.
Policy does not deter use among those who can afford to pay for water.
PPP mode may not ensure equity.
Policy does not follow polluter pay principle, rather it gives incentives for effluent treatment.
Policy was criticized for terming Water as an economic good.
In some regions it has not yet become successful .
The policy does not focus on the reduction of water pollution.
The policy doesn’t lay out objective for commercial use of water, especially ground wate
Strategy for New India @ 75
Objectives
By 2022-23, India’s water resources management strategy should facilitate water security to ensure adequate availability of water for life, agriculture, economic development, ecology and environment.
This broader vision can be achieved by attaining the following sectoral goals:
• Provide adequate (rural: 40 litres per capita per day (lpcd); urban 135 lpcd) and safe drinking water (piped) and water for sanitation for citizens and livestock.
• Provide irrigation to all farms (Har Khet Ko Pani) with improved on-farm water-use efficiency (more crop per drop).
• Provide water to industries, encourage industries to utilize recycled/treated water and ensure zero discharge of untreated effluents from industrial units.
• Ensure Aviral and Nirmal Dhara in the Ganga and other rivers along with their tributaries.
• Create additional water storage capacity to ensure full utilization of the utilizable surface water resources potential of 690 billion cubic metres (bcm).
• Ensure long-term sustainability of finite ground water resources.
• Ensure proper operation and maintenance of water infrastructure with active participation of farmers/consumers.
• Promote R&D to facilitate adoption of the latest technologies in the water sector.
Way Forward
1. On-going programmes
• By 2022-23, the water storage capacity needs to be increased from the current level of 253 bcm to 304 bcm by completing on-going projects on time.
• A coordination mechanism at the field level may be set up for PMKSY to find the reasons for delays in the completion of projects and corrective measures undertaken project wise to
ensure speedy implementation.
• The Ministry of Water Resources (MoWR) may draw up an action plan to complete CAD works in 317 identified projects to reduce the gap between the irrigation potential created and utilized.
• Other notable programmes that need to be completed include the Ken-Betwa River linking project, the Pancheshwar project, the Rajasthan feeder and Sirhind feeders (Punjab Rajasthan) and the Siang project in North-East India.
• The National Mission for Clean Ganga needs to coordinate with the Ministry of Drinking Water, Supply and Sanitation for solid and liquid waste management in 1600 gram panchayats (covering 4464 villages situated on the banks of the Ganga in five states). Corrective measures need to be taken to expedite the completion of the projects.
2. Water efficiency
• Incentivize the wider adoption of sprinkler and drip irrigation by diverting resources otherwise used to subsidize power and surface irrigation.
• As per the fourth Minor Irrigation (MI) Census, there are about 5 lakh water bodies/tanks with an irrigation potential of 5.89 million ha. For these, the MoWR’s programme to revitalize, renovate and repair water bodies should be significantly expanded and adequately funded.
• Special emphasis should be laid on desilting of water bodies, including river, lakes, ponds and reservoirs.
3. Recycle of waste water
• With the country generating 140 bcm of wastewater annually, a pilot scheme to irrigate 10 lakh ha with treated waste water by 2020 may initially be taken up.
• Industries should be encouraged to meet a major share of their demand through recycled water. Besides, programmes for smart water meters and tradable permits for use of recycled
water may be launched.
4. Groundwater management
• As on date, development of groundwater, i.e., utilization of groundwater resources vis-à-vis replenishable quantity, is 62 per cent. There is a need to develop recharging zones at identified places to make groundwater resources sustainable using check dam, farm ponds, tanks and injection wells.
• Participatory aquifer management initiated in the 12th Plan National Aquifer Management (NAQUIM) under PMKSY should be strengthened through a network of partnerships
to control unbridled, competitive extraction of groundwater since it is virtually impossible to police more than 30 million groundwater structures through licences and permits.
• The participatory approach to encourage behavioural changes and community engagement in ground water management at the gram panchayat level as envisaged in the
Atal Bhujal Yojana (ABHY) should be adopted and extended to other regions.
• Promote the use of solar pumps to improve the utilisation of groundwater in Eastern India where utilisation is hampered by the lack of power. In Western India, solar pumps with a
buyback guarantee for surplus solar power can offer reliable daytime energy for irrigation and stable cash income as well act as an incentive to conserve power and water.
• PMKSY – Har Khet Ko Pani – envisaging enhancement of food production more than two-fold in 96 prioritized most ‘deprived irrigation districts’ in 12 states by creating irrigation facilities through tube wells, dug wells, bore wells and dug-cum-bore wells, should be expedited. This will facilitate assured irrigation in tribal and backward areas that traditionally have
been deprived of canal irrigation.
• Special focus should be placed on the quality of rural drinking water supply in arsenic and fluoride affected areas by tapping multiple sources through conjunctive use of surface water, ground water and rain water harvesting. All new, piped water supply schemes should have mandatory provisions on operation and maintenance involving local communities and stakeholders.
5. Water harvesting
a. Watershed (check dam development)
• The MoWR may develop specific strategies to tap water through watershed development (check dams) in rain-fed areas, expand micro irrigation coverage to 80 lakh ha, and
link ground water development to aquifer mapping.
• The timeline for watershed development projects needs to be shortened from seven to four years with special efforts by state governments. Funds available under MGNREGA
and state plans may be used for watershed ,development projects.
• Introduce public-private partnerships in the water sector, initially to develop microirrigation- based CAD works based on a hybrid annuity model. This should be accompanied
by a revision in water tariffs to recover at least operation and maintenance costs.
b. Rainwater harvesting
• Model Building Bye Laws, 2016 circulated by Ministry of Urban Development includes the provision of rain water harvesting. Barring the states/UTs of Manipur, Sikkim, Mizoram and
Lakshadweep, all states have incorporated the provision in their respective Building Bye Laws. It is suggested that the states ensure effective ,implementation of the rain water harvesting structures for buildings.
6. Suggested reforms
• To mitigate conflicts and achieve equitable distribution of water, an integrated river basin management approach needs to be adopted. The setting up of river basin organisations for
major basins may be expedited.
• NITI Aayog has developed a concept note on Revitalization of Rivers, which may be implemented on a pilot basis before being expanded across major states.
• To ensure Aviral and Nirmal Dhara in the Ganga, the river should be managed as a single system.
• There is need for a scheme on medium term measures for flood management. This should include completion of incomplete works in the states of Assam, Bihar, Uttar Pradesh, Uttarakhand and West Bengal. Besides, long term measures for Bihar, UP and NE states should be explored to achieve permanent protection from floods. The formation of North East Water Management Authority (NEWMA) in North- East states will comprehensively address the ,flood issue in the region.
• A water regulatory framework should be established for water resources in all states.
• An action plan should be drawn up to improve water use efficiency (with 2017 as the base year) by 20 per cent in all sectors by 2022.
• The composite water management index developed by NITI Aayog may be used as a potent tool to assess and further improve the efficiency of water resources management.
Interlinking of Rivers
Brief Background
The idea of interlinking rivers was first mooted by the Chief Engineer of the Madras Presidency in 1919, Sir Arthur Cotton.
- This idea was revisited in 1960 by the then Minister of State for Energy and Irrigation, KL Rao, who proposed to link rivers Ganga and Cauvery.
- The National Water Development Agency was established by the former Prime Minister Indira Gandhi in 1982.
- In 2002, the Supreme Court asked the government to finalise a plan for interlinking rivers by 2003 and execute it by 2016.
- A task force was formed by the government for the same in 2003.
- In 2012, the SC again asked the government to start the project.
- In 2014, the Ken-Betwa River Linking Project got Cabinet approval. However, the project is yet to take off because of opposition faced by the government chiefly from environmentalists.

What is Inter-linking of Rivers (ILR)?
The idea behind the interlinking of rivers is that many parts of the country face problems of drought while many others face the problem of flooding every year.
- The Indo-Gangetic rivers are perennial since they are fed by rains as well as the glaciers from the Himalayas.
- The peninsular rivers in India are however, not seasonal because they are rain-fed mainly from the south-west Monsoons.
- Due to this, the Indo-Gangetic plains suffer from floods and the peninsular states suffer from droughts.
- If this excess water can be diverted from the Plains to the Peninsula, the problem of floods and droughts can be solved to a large extent.
- Hence, the interlinking of rivers will bring about an equitable distribution of river waters in India.
National Interlinking of Rivers Authority
- To be called the NIRA, the proposed body is expected to take up both inter-State and intra-State projects.
- It will also make arrangements for generating up funds, internally and externally.
- Headed by Union Minister of Jal Shakti, the panel includes Irrigation or Water Resources Ministers and Secretaries of States.
- It is being assisted by a Task Force for ILR, which is a committee of experts essentially drawn from the Jal Shakti Ministry, Central Water Commission and the NWDA.
National River Linking Project (NRLP)
This project envisages the transfer of water from water-excess basin to water-deficient basin by interlinking 37 rivers of India by a network of almost 3000 storage dams. This will form a gigantic south Asian water grid.
There are two components to this project:
- Himalayan Component
- Peninsular Component
Himalayan Component of NRLP
Under the Himalayan component of the NRLP, there are 14 projects in the pipeline.
- Storage dams will be constructed on the rivers Ganga and Brahmaputra, and also their tributaries.
- The linking of the Ganga and the Yamuna is also proposed.
- Apart from controlling flooding in the Ganga – Brahmaputra river system, it will also benefit the drought-prone areas of Rajasthan, Haryana and Gujarat.
- This component has two sub-components:
- Connecting the Ganga and Brahmaputra basins to the Mahanadi basin.
- Connecting the Eastern tributaries of the Ganga with the Sabarmati and Chambal river systems.
Peninsular Component of NRLP
This component of the NRLP envisages the linking of the 16 rivers of southern India.
- Surplus water from the Mahanadi and the Godavari will be transferred to the Krishna, Cauvery, Pennar and the Vaigai rivers.
- Under this component, there are four sub-component linkages:
- Linking Mahanadi and Godavari river basins to Cauvery, Krishna and Vaigai river systems.
- Ken to Betwa river, and Parbati & Kalisindh rivers to Chambal river.
- West-flowing rivers to the south of Tapi to the north of Bombay.
- Linking some west-flowing rivers to east-flowing rivers.
Benefits of River Interlinking
There are many benefits that the proposed interlinking projects will bring about. They are discussed below:
- Interlinking rivers is a way to transfer excess water from the regions which receive a lot of rainfall to the areas that are drought-prone. This way, it can control both floods and droughts.
- This will also help solve the water crisis in many parts of the country.
- The project will also help in hydropower generation. This project envisages the building of many dams and reservoirs. This can generate about 34000 MW of electricity, if the whole project is executed.
- The project will help in dry weather flow augmentation. That is, when there is a dry season, surplus water stored in the reservoirs can be released. This will enable a minimum amount of water flow in the rivers. This will greatly help in the control of pollution, in navigation, forests, fisheries, wildlife protection, etc.
- Indian agriculture is primarily monsoon-dependent. This leads to problems in agricultural output when the monsoons behave unexpectedly. This can be solved when irrigation facilities improve. The project will provide irrigation facilities in water-deficient places.
- The project will also help commercially because of the betterment of the inland waterways transport system. Moreover, the rural areas will have an alternate source of income in the form of fish farming, etc.
- The project will also augment the defence and security of the country through the additional waterline defence.
Challenges in River Interlinking
Despite the many benefits that are associated with the river interlinking project, the project is yet to take off because of the many hurdles it is facing. Some of the challenges in this regard are as follows:
- Project feasibility: The project is estimated to cost around Rs.5.6 lakh crores. Additionally, there is also the requirement of huge structures. All this requires a great engineering capacity. So, the cost and manpower requirement is immense.
- Environmental impact: The huge project will alter entire ecosystems. The wildlife, flora and fauna of the river systems will suffer because of such displacements and modifications. Many national parks and sanctuaries fall within the river systems. All these considerations will have to be taken care of while implementing the project. The project can reduce the flow of freshwater into the sea, thus affecting marine aquatic life.
- Impact on society: Building dams and reservoirs will cause the displacement of a lot of people. This will cause a lot of agony for a lot of people. They will have to be rehabilitated and adequately compensated.
- Controlling floods: Some people express doubts as to the capability of this project to control floods. Although theoretically it is possible, India’s experience has been different. There have been instances where big dams like Hirakud Dam, Damodar Dam, etc. have brought flooding to Odisha, West Bengal, etc.
- Inter-state disputes: Many states like Kerala, Sikkim, Andhra Pradesh, etc. have opposed the river interlinking project. Read more on interstate river disputes in India at the linked article.
- International disputes: In the Himalayan component of the project, the effect of building dams and interlinking rivers will have an effect on the neighbouring countries. This will have to be factored in while implementing the project. Bangladesh has opposed the transfer of water from the Brahmaputra to the Ganga.
Inter-State River Water Sharing Disputes
The Inter-State River Water Disputes are one of the most contentious issues in the Indian federalism today.
The recent cases of the Cauvery Water Dispute and the Satluj Yamuna Link Canal are some examples.
Various Inter-State Water Disputes Tribunals have been constituted so far, but they had their own problems.
Constitutional Provisions
Entry 17 of State List deals with water i.e. water supply, irrigation, canal, drainage, embankments, water storage and water power.
Entry 56 of Union List empowers the Union Government for the regulation and development of inter-state rivers and river valleys to the extent declared by Parliament to be expedient in the public interest.
According to Article 262, in case of disputes relating to waters:
Parliament may by law provide for the adjudication of any dispute or complaint with respect to the use, distribution or control of the waters of, or in, any inter-State river or river valley.
Parliament may, by law provide that neither the Supreme Court nor any other court shall exercise jurisdiction in respect of any such dispute or complaint as mentioned above.
| Major Inter-State River Disputes | |
| River (s) | States |
| Ravi and Beas | Punjab, Haryana, Rajasthan |
| Narmada | MP, Gujarat, Mah., Ra. |
| Krishna | Mah., AP, Karnataka, Telangana |
| Vamsadhara | An. Pradesh & Odisha |
| Cauvery | Kerala, Kar., TN and Puducherry |
| Godavari | M., An. P., Kar., MP, Odisha |
| Mahanadi | Chhattisgarh, Odisha |
| Mahadayi | Goa, Maharashtra, Karnataka |
| Periyar | Tamil Nadu, Kerala |
Mechanism for Inter-State River Water Disputes Resolution
- The resolution of water dispute is governed by the Inter-State River Water Disputes Act, 1956.
- According to its provisions, if a State Government makes a request regarding any water dispute and the Central Government is of opinion that the water dispute cannot be settled by negotiations, then a Water Disputes Tribunal is constituted for the adjudication of the water dispute.
- The act was amended in 2002, to include the major recommendations of the Sarkaria Commission.
- The amendments mandated a one year time frame to setup the water disputes tribunal and also a 3 year time frame to give a decision.
Active River Water Dispute Tribunals in India
- Krishna Water Disputes Tribunal II (2004) – Karnataka, Telangana, Andra Pradesh, Maharashtra
- Mahanadi Water Disputes Tribunal (2018) – Odisha & Chattisgarh
- Mahadayi Water Disputes Tribunal (2010) – Goa,Karnataka, Maharashtra
- Ravi & Beas Water Tribunal (1986) – Punjab, Haryana, Rajasthan
- Vansadhara Water Disputes Tribunal (2010) – Andra Pradesh & Odisha.
Issues with Interstate Water Dispute Tribunals
- Protracted proceedings and extreme delays in dispute resolution.
- For example, in the case of Godavari water dispute, the request was made in 1962, but the tribunal was constituted in 1968 and the award was given in 1979 which was published in the Gazette in 1980.
- The Cauvery Water Disputes Tribunal, constituted in 1990, gave its final award in 2007.
- Opacity in the institutional framework and guidelines that define these proceedings; and ensuring compliance.
- Though award is final and beyond the jurisdiction of Courts, either States can approach Supreme Court under Article 136 (Special Leave Petition) under Article 32 linking issue with the violation of Article 21 (Right to Life).
- The composition of the tribunal is not multidisciplinary and it consists of persons only from the judiciary.
- The absence of authoritative water data that is acceptable to all parties currently makes it difficult to even set up a baseline for adjudication.
- The shift in tribunals’ approach, from deliberative to adversarial, aids extended litigation and politicisation of water-sharing disputes.
- The growing nexus between water and politics have transformed the disputes into turfs of vote bank politics.
- This politicisation has also led to increasing defiance by states, extended litigations and subversion of resolution mechanisms.
- For example, the Punjab government played truant in the case of the Ravi-Beas tribunal.
- Too much discretion at too many stages of the process.
- Partly because of procedural complexities involving multiple stakeholders across governments and agencies.
- India’s complicated federal polity and its colonial legacy.
The Inter-State River Water Disputes (Amendment) Bill, 2017
- In order to further streamline the adjudication of inter-State river water disputes, the Inter-State River Water Disputes (Amendment) Bill, 2017 was introduced in Lok Sabha in March 2017 by amending the existing ISRWD Act, 1956.
- The Bill envisages to constitute a standalone Tribunal with permanent establishment and permanent office space and infrastructure so as to obviate the need to set up a separate Tribunal for each water dispute which is invariably a time consuming process.
- In the proposed Bill, there is a provision for establishment of a Dispute Resolution Committee (DRC) by the Central Government for resolving amicably, the inter-State water disputes within a maximum period of one year and six months.
- Any dispute, which cannot be settled by negotiations shall be referred to the Tribunal for its adjudication.
- The dispute so referred to the Tribunal shall be assigned by the Chairperson of the Tribunal to a Bench of the Tribunal for adjudication.
- Under the Bill, the requirement of publication of the final decision of tribunal in the official gazette has been removed.
- The Bill adds that the decision of the bench of the tribunal will be final and binding on the parties involved in the dispute
- The Bill also calls for the transparent data collection system at the national level for each river basin and a single agency to maintain data bank and information system.
- The proposed amendments in the Bill will speed up the adjudication of water disputes referred to it.
- The Bill was referred to Parliamentary Standing Committee on Water Resources for examination.
- The Standing Committee has submitted its recommendation on the Bill, accordingly, the Ministry has prepared draft Cabinet Note for Official Amendments to Inter-State River Water Disputes (Amendment) Bill, 2017.
Conclusion
- The Centre’s proposal to set up a single, permanent tribunal to adjudicate on inter-state river water disputes could be a major step towards streamlining the dispute redressal mechanism.
- However, this alone will not be able to address the different kinds of problems—legal, administrative, constitutional and political—that plague the overall framework.
- Centre’s proposal to set up an agency alongside the tribunal, that will collect and process data on river waters can be a right step in this direction.
- To strengthen the cooperative federalism, parochial mindset making regional issues superior to national issues should not be allowed.
- So disputes must be resolved by dialogue and talks and the political opportunism must be avoided.
- A robust and transparent institutional framework with cooperative approach is need of the hour.
.
Power Resources
Power Resources
ATOMIC MINERALS
Uranium
- Uranium deposits occur in Jaduguda of Singbhum and Hazaribagh districts of Jharkhand, Gaya district of Bihar and Saharanpur district of Uttar Pradesh.
- India accounts for only 2% of world Uranium production.
Thorium
- It is found in the Monazite sands of Placer deposits of coastal regions.
- Although Monazite sands are found in east and west coast, the largest concentration is on the Kerala coast.
- Thorium is also extracted from Thorianite.
- Kerala, Jharkhand, Bihar, Tamil nadu and Rajasthan are the major producers of Thorium.
Beryllium
- Beryllium oxide is used as moderator in nuclear reactors.
- India has sufficient reserves of Beryllium.
Lithium and Zirconium
- Lithium is a light metal which is distributed in the states of Jharkhand, Madhya Pradesh and Rajasthan.
- Zirconium is found in Kerala coasts and in alluvial deposits of Ranchi and Hazaribagh of Jharkhand.
Coal
- India has the fifth largest coal reserves in the world, and is the fourth largest producer of coal in the world, producing 662.79 million metric tons (730.60 million short tons) in 2016-17.
- As on 31 March 2017, India had 315.14 billion metric tons (347.38 billion short tons) of the resource.
- The estimated total reserves of lignite coal as on 31 March 2017 was 44.70 billion metric tons (49.27 billion short tons).
- Due to high demand and poor average quality, India is forced to import high quality coal to meet the requirements of steel plants.
- India’s coal imports have risen from 49.79 million metric tons (0.05488 billion short tons) in 2007-08 to 190.95 million metric tons (0.21049 billion short tons) in 2016-17.
- India’s coal exports rose from 1.63 million metric tons (1.80 million short tons) in 2007-08 to 2.44 million metric tons (2.69 million short tons) in 2012-13, but subsequently declined to 1.77 million metric tons (1.95 million short tons) in 2016-17. Dhanbad city is the largest coal producing city.
Coal Reserves
As a result of exploration carried out up to the maximum depth of 1200m by the GSI, CMPDI, SCCL and MECL etc, a cumulative total of 319.02 Billion tonnes of Geological Resources of Coal have so far been estimated in the country as on 1.4.2018. The details of state-wise geological resources of Coal are given as under:
|
St |
Proved |
Indicated |
Inferred |
Total |
|
Total |
148787 |
139164 |
31069 |
319020 |
|
JH |
45563 |
31439 |
6150 |
83152 |
|
OD |
37391 |
34165 |
7739 |
79295 |
|
CH |
20428 |
34576 |
2202 |
57206 |
|
WB |
14156 |
12869 |
4643 |
31667 |
|
MP |
11958 |
12154 |
3875 |
27987 |
|
TEL |
10475 |
8576 |
2651 |
21702 |
|
MA |
7178 |
3074 |
2048 |
12299 |
(Million tonnes)
(Source: Geological Survey of India)
|
St |
Proved |
Indicated |
Inferred |
Total |
|
An. P |
0 |
1149 |
432 |
1581 |
|
B |
161 |
813 |
392 |
1367 |
|
UP |
884 |
178 |
0 |
1062 |
|
ME |
89 |
17 |
471 |
576 |
|
AS |
465 |
57 |
3 |
525 |
|
NA |
9 |
0 |
402 |
410 |
|
SI |
0 |
58 |
43 |
101 |
|
ARP |
31 |
40 |
19 |
90 |
(Source: Geological Survey of India)
CATEGORISATION
The Coal resources of India are available in older Gondwana Formations of peninsular India and younger Tertiary formations of north-eastern region. Based on the results of Regional/Promotional Exploration, where the boreholes are normally placed 1-2 Km apart, the resources are classified into ‘Indicated’ or ‘Inferred’ category. Subsequent Detailed Exploration in selected blocks, where boreholes are less than 400 meter apart, upgrades the resources into more reliable ‘Proved/Measured’ category. The Formation-wise and Category-wise Coal resources of India as on 1.4.2018 are given in table below:
|
Formation |
Proved/ |
Indicated |
Inferred |
Total |
|
Grand Total |
148787 |
139164 |
31069 |
319020 |
|
Gondwana |
148194 |
139065 |
30174 |
317433 |
|
Tertiary |
594 |
99 |
895 |
1588 |
(Source: Geological Survey of India)
Coal Production
The production of coal was 662.79 million metric tons (730.60 million short tons) in 2016-17, a growth of 4.69% over the previous year. The production of lignite was 45.23 million metric tons (49.86 million short tons) in 2016-17, a growth of 3.17% over the previous fiscal. India is ranked 2nd in world coal production.
The top producing states are:
- Odisha – Talcher in Angul district
- Chhattisgarh
- Jharkhand
Other notable coal-mining areas include:
- Korba Coalfield in Korba District, Chhattisgarh (Gevra Mines: Asia’s largest open cast mine)
- Singareni collieries in Bhadradi district (Old Khammam District), Telangana
- Jharia mines in Dhanbad district, Jharkhand
- Nagpur & Chandrapur district, Maharashtra
- Raniganj in Bardhaman district, West Bengal
- Neyveli lignite mines in Cuddalore district, Tamil Nadu
- Singrauli Coalfield and Umaria Coalfield in Madhya Pradesh
Coal Consumption
- Industries in India consumed 841.56 MT of raw coal in 2016-17. The largest consumers of coal in India are electricity generation (527.26 MT), steel and washery industries (54.15 MT), cement industries (6.43 MT) and sponge iron industries (5.68 MT). Consumption of lignite stood at 43.16 MT in 2016-17. Electricity generation alone accounts for 89.96% of the total lignite consumption.
- Due to high demand and poor average quality, India is forced to import high quality coal to meet the requirements of steel plants. India’s coal imports have risen from 49.79 million metric tons (0.05488 billion short tons) in 2007-08 to 190.95 million metric tons (0.21049 billion short tons) in 2016-17. India’s coal exports rose from 1.63 million metric tons (1.80 million short tons) in 2007-08 to 2.44 million metric tons (2.69 million short tons) in 2012-13, but subsequently declined to 1.77 million metric tons (1.95 million short tons) in 2016-17.
UPSC_Pre_MCQ
Which one of the following types of coal contains a higher percentage of carbon than the rest? [1999] (a) Bituminous coal(b)Lignite (c)Peat (d)Anthracite
Ans (d)Anthracite is a dense, shiny coal that has a high carbon content. Very little volatile matter is present in it. It gives a clean flame while burning. Anthracite contains 91% of carbon; is very little volatile and has almost smokeless burning.
Consider the following statements:[2006] 1.Petronet LNG Ltd. is setting up another LNG terminal at Mangalore. 2.The Head Office of the Dredging Corporation of India is at Vishakhapatnam. 3.The Narwapahar Mine is operated by the Uranium Corporation of India Limited. Which of the statements given above are correct? (a)1, 2 and 3 (b)1 and 2 only (c)2 and 3 only (d)1 and 3 only
Ans.(c)
In which one of the following states are Namchik Namphuk coalfields located?[2008] (a)Arunachal Pradesh (b)Meghalaya (c)Manipur (d)Mizoram
Ans.(a)Namchik-Namphuk coalfields are located in Arunachal Pradesh.
Consider the following statements:[2009] 1.India does not have any deposits of Thorium. 2.Kerala’s monazite sands contains Uranium. Which of the statements given above is/are correct? (a)1 only (b)2 only (c)Both 1 and 2 (d)Neither 1 nor 2
Ans.(d)India has 12% of thorium deposits of the world.
Consider the following statements:[2013 – I] 1.Natural gas occurs in the Gondwana beds. 2.Mica occurs in abundance in Kodarma. 3.Dharwars are famous for petroleum. Which of the statements given above is/are correct? (a)1 and 2 (b)2 only (c)2 and 3 (d)None
Ans.(b)Dharwar rocks are non fossilliferous rather they are metalliferous. They bear out gold, iron ore, manganese mica, cobalt, chromium, copper, tungsten, lead, nickel, precious stones and budding stones. Kodarma is a store house of mica and Gondwana beds has coal and not natural gass.
.
Mineral Resources
General Information
Minerals in the National Economy
- The mining and quarrying sector accounted for 2.6% of the GDP in 2015.
- Manufacturing sector accounted for 16.3% of the GDP compared in 2015.
- In 2015, 129,000 workers were employed in mining and quarrying.
- Foreign direct investment was $44.1 billion in 2015.
India produced 16 metals, 33 industrial minerals, and 4 mineral fuels and related materials.
India ranked:
-
- 1st in the world in production of garnet (industrial);
- 2d, of cement, kaolin, pig iron, and wollastonite (not including U.S. production);
- 3d, of barite, crude (raw) steel, lime, nitrogen, and salt;
- 4th, of alumina, bentonite, and iron ore;
- 5th, of bauxite, bromine (not including U.S. production), and zinc;
- 6th, of manganese (not including U.S. production), sulfur (byproduct), and rutile
- 7th, of lead and zircon;
- 8th, of mica (natural);
The country’s estimated share of world production of garnet (industrial) amounted to 47%; wollastonite (not including U.S. production), 26%; kaolin, 13%; barite, 9%; bauxite and nitrogen (ammonia), 8% each; bentonite, cement, and iron ore, 7% each; crude steel, salt, and zinc, 6% each; and lime, manganese, mica (sheet), and pig iron, 5% each.
The number of mines in India
- The number of mines which reported mineral production (excluding atomic, fuel and minor minerals) in India was 1531 in 2017-18 as against 1508 in the previous year.
- Out of 1531 reporting mines, 230 were located in Tamil Nadu, followed by Madhya Pradesh (197) Gujarat (191), Karnataka (142), Odisha (132), Andhra Pradesh (129), Chhattisgarh (112), Goa (87), Rajasthan (85), Maharashtra (75) and Jharkhand (58).
- These 10 States together accounted for 94% of total number of mines in the country in 2017-18.
State wise Value of mineral production in India
During 2017-18, mineral production was reported from 32 States/Union Territories (actual reporting of MCDR from 22 states and estimation of minor minerals for all 32 States/Union Territories) of which the bulk of value of mineral production (excluding fuel and atomic minerals) of about 93.65% was confined to 10 States. Rajasthan is in leading position, in terms of estimated value of mineral production in the country and had
the share of 20.26% in the national output.
Next in order was Odisha with a share of 17.77% followed by Andhra Pradesh (9.45%), Chhattisgarh (8.80%), Karnataka (7.83%), Telangana (6.06%), Gujarat (5.66%), Uttar Pradesh (4.98%), Maharashtra (4.67%) and Bihar (3.77%) in the total value of mineral production.
Degree of Self-sufficiency in Principal Minerals & Metals, 2015-16(P)
Column 1 – SN
Column 2 – Commodity
Column 3 – Demand/Domestic consumption (‘000 tonnes)
Column 4 – Supply/Domestic supply (‘000 tonnes)
Column 5 – Order of self sufficiency (%)
|
C1 |
C2 | C3 |
C4 |
C5 |
|
1 |
Bauxite |
1,408 |
28,133 |
100 |
|
2 |
Chromite |
2,191 |
2,894 |
100 |
|
3 |
Fluorite |
64 |
2 |
3 |
|
4 |
Ironore |
1,22,619 |
1,55,910 |
100 |
|
5 |
Kyanite |
3 |
3 |
100 |
|
6 |
Limestone & other |
3,07,355 |
3,03,8151/ |
99 |
| C1 | C2 | C3 | C4 | C5 |
|
7 |
Magnesite |
263 |
265 |
100 |
|
8 |
Manganese |
3,544 |
2,148 |
61 |
|
9 |
Rock phosphate |
4,363 |
1,474 |
34 |
|
10 |
Sillimanite |
34 |
70 |
100 |
|
11 |
Aluminium |
2,872 |
2,355 |
82 |
|
12 |
Copper (refined) |
820 |
790 |
96 |
|
13 |
Lead (primary/refined) |
266 |
145 |
55 |
|
14 |
Zinc (slab) |
669 |
759 |
100 |
Mineral Belts
Belt 1 – Chottanagpur belt
Belt 2 – Midland belt
Belt 3 – Southern belt
Belt 4 – Western belt
Belt 5 – South western belt
Belt 6 – Himalayan belt
Belt 7 – Indian ocean belt
|
B |
States |
Minerals found |
|
1 |
Jharkhand, Bihar, Odisha, Chhattisgarh, West Bengal |
Coal, Mica, Manganese, Chromite, Ilmenite, Bauxite, Iron, Copper, Dolomite, china clay, Limestone |
|
2 |
Chhattisgarh, Madhya Pradesh, Andhra Pradesh, Maharashtra |
Manganese, Bauxite, Mica, Copper, Graphite, Limestone, Lignite and Marble |
|
3 |
Andhra Pradesh, Karnataka, Tamil nadu |
Gold, Iron ore, Chromite, Manganese, Lignite, Mica, Bauxite, Gypsum, Asbestos, Dolomite, Ilmenite, Limestone |
|
4 |
Rajasthan, Gujarath, Maharashtra |
Copper, Lead, Zinc, Uranium, Mica, Manganese, Asbestos, precious stones, mineral oil and natural gas |
|
B |
States |
Minerals found |
|
5 |
Goa, Karnataka, Kerala |
Iron ore, Ilmenite, Zircon, Monazite, Garnet, Bauxite, Mica, Limestone |
|
6 |
Jammu and Kashmir, Uttarakhand, Assam |
Copper, Lead, Zinc, Bismuth, Bauxite, Antimony, Nickel, Cobalt, Tungsten, precious stones, gold, silver, gypsum, limestone, dolomite |
|
7 |
Continental shelf region of Arabian sea and Bay of Bengal |
Mineral oil, natural gas |
Production
|
Mineral |
Quantity |
Unit |
Min type |
|
683 |
MT |
Fuel |
|
|
32,249 |
MCT |
Fuel |
|
|
36.9 |
MT |
Fuel |
|
|
28.134 |
MT |
MM |
|
|
3.9 |
MT |
MM |
|
|
1594 |
KG |
MM |
|
|
156 |
MT |
MM |
|
|
145 |
TT |
MM |
|
|
2148 |
TT |
MM |
|
|
759 |
TT |
MM |
|
|
31836091 |
NMM |
||
|
3,651 |
TT |
NMM |
|
|
170 |
MT |
NMM |
|
|
1,383 |
TT |
NMM |
Million tonnes – MT, Thousand tonnes – TT, Million cubic metres – MCM
Metallic Mineral – MM, Non Metallic Mineral – NMM,
Top Producing States
Iron ore – Odisha
Coal – Chhattisgarh
Manganese – Madhya Pradesh
Bauxite – Odisha
Mica – Andhra Pradesh
Gold – Karnataka
Limestone – Rajasthan
Ešarytes -Andhra Pradesh
Copper – Madhya Pradesh
Diamond – Madhya Pradesh
Lignite – Tamil Nadu
Chromite – Odisha
Exports
|
Mineral |
Quantity |
Unit |
|
896,518 |
TT |
|
|
Bauxite |
1,131,472 |
TT |
|
Coal |
1,374 |
TT |
|
Copper |
18,990 |
TT |
|
Gypsum & plaster |
103,003 |
TT |
|
Iron ore |
83,165 |
TT |
|
Lead |
81,157 |
TT |
|
Limestone |
343,814 |
TT |
|
Manganese ore |
317,787 |
TT |
|
Marble |
234,455 |
TT |
|
Mica |
97,842 |
TT |
|
Natural gas |
29,523 |
TT |
|
Sulphur |
2,465 |
TT |
|
Zinc |
180,704 |
TT |
Non-Metallic Minerals
- Non-metallic minerals – fossil fuels, derived from the buried animal and plant life such as coal and petroleum or inorganic in origin such as mica, limestone and graphite, etc.
- Among the non-metallic minerals produced in India, mica is the important one. The other minerals extracted for local consumption are limestone, dolomite and phosphate.
- India presently produces a total of 47 non-metallic minerals.
- The resource base of industrial / non-metallic minerals in India is adequate except for Rock Phosphate, Magnesite and Ball Clay, for which the estimates show decreasing reserves.
Mica
Significance of Mica
- It has a unique combination of elasticity, toughness, flexibility and transparency.
- It possesses resistance to heat and sudden change in temperature and high dielectric strength.
- It is chemically inert, stable and does not absorb water.
- It possesses highly perfect basal cleavage due to which it can easily and accurately split into very thin sheets which are tough and flexible.
- Mica is mainly used in the electrical and electronic industries.
- The three major types of mica found in India are — Muscovite, Phiogopite and Biotite.
Distribution of Mica in India
Bihar (Gaya), Jharkhand (Hazaribagh), Rajasthan (Ajmer, Shahpur,Tonk, Bhilwara, Jaipur), Andhra
Pradesh (Nellore)
State wise total resource distribution of Mica is as follows:-
- Andhra Pradesh leads with 41% share in country’s total resources followed by
- Rajasthan (21%)
- Odisha (20%)
- Maharashtra (15%)
- Bihar (2%) and
- The remaining 1% is in Jharkhand and Telangana together.
Occurrence of Mica in India
Jharkhand: In Jharkhand high-quality mica is obtained in a belt extending over a distance of about 150 km, in length and about 22 km, in width in lower Hazaribagh plateau. The main centres of mica production in this belt are Kodarma, Dhorhakola, Domchanch, Dhab, Gawan, Tisri, Chakai and Chakapathal.
- Andhra Pradesh: Andhra Pradesh is the largest mica producing state of India. In Andhra Pradesh. Nellore district produces the best quality mica.
- Rajasthan: In Rajasthan mica belt extends for about 320 kms from Jaipur to Bhilwara and around Udaipur
- Karnataka: Mica deposits occur in Mysuru and Hasan districts of Karanataka
- Tamil Nadu: in Tamil Nadu, Coimbatore, Tiruchirapalli, Madurai and Kanniyakumari districts
- Kerala: in Kerala, Mica deposits are found in Alleppey district.
- Maharashtra: Ratnagiri in Maharashtra has rich mica deposits
- West Bengal: Purulia and Bankura in West Bengal are known for mica deposits.
Limestone
Significance
- The term limestone is applied to any calcareous sedimentary rock consisting essentially of carbonates.
- The two most important constituents are calcite and dolomite.
- Limestones altered by dynamic or contact metamorphism become coarsely crystalline and are referred to as ‘marbles’ and ‘crystalline limestones’.
- However, the limestone which is used by industries in bulk quantity is a bedded type sedimentary limestone.
- Limestone is the primary constituent for the manufacture of cement.
- Other important uses of limestone are as in Glass, Ceramic, Paper, Textile, fertilizer, chemical and sugar industry.
Distribution
Limestone occupies the top position in India, among non-fuel solid mineral deposits as per volume of annual extraction. Given India’s rapid urbanization and the demand for housing as well as infrastructure, demand for limestone is likely to increase further.
State wise total resource distribution of limestone is as following:-
- Karnataka is the leading state having 28% of the total resources followed by
- Andhra Pradesh, Gujarat and Rajasthan (11% each),
- Telangana (9%),
- Chhattisgarh (5%),
- Madhya Pradesh (4%) and
- remaining 21% by other states.
Occurrence
As per 2014-15 data, State wise production of limestone:-
Rajasthan: as per 2014-15 data, Rajasthan was the leading producing state accounting for (21%) of the total production of limestone. Jhunjhunu, Banswara, Jodhpur, Ajmer, Bikaner, Dungarpur, Kota, Tonk, Alwar, Sawai Madhopur, Nagaur etc. are the major limestone producing districts in Rajasthan.
Madhya Pradesh: Madhya Pradesh accounts for about 13% limestone production in India. Jabalpur, Satna, Betul, Sagar, Damoh and Rewa are the major limestone producing districts in MP.
Andhra Pradesh: Andhra Pradesh accounts for about 12% Limestone production in India. Cuddapah, Kumool, Guntur, Krishna are among the major deposits of limestone in Andhra Pradesh.
Gujarat: Gujarat accounts for about 9% Limestone production in India. Major limestone producing districts in Guajarat are Amreli, Kachchh, Surat, Junagadh, Kheda and Panchmahals.
Chhattisgarh: Chhattisgarh accounts for about 8% limestone production in India. Major deposits of limestone occur in Bastar, Bilaspur, Raigarh, Raipur and Durg districts.
Tamil Nadu: Tamil Nadu also accounts for about 8% limestone production in India. Ramnathapuram, Tirunelveli, Tiruchchirappalli, Salem, Coimbatore, Madurai, and Thanjavur are the major limestone producing districts in Tamil Nadu.
Karnataka: Karnataka accounts for about 8% limestone production in India. The major limestone producing districts in Karnataka are Gulbarga, Chitradurg, Tumkur, Belgaum, Bijapur, Mysore and Shimoga.
Telangana: Telangana accounts for about 8% limestone production in India. Nalgonda, Adilabad, Warangal, Mahabubnagar and Karimnagar are among the major deposits of limestone in Telangana.
Other states: The remaining 5% was contributed by Meghalaya, Odisha, Uttar Pradesh, Jharkhand, Assam, Kerala, Bihar and Jammu & Kashmir.
Other Important Non – Metallic Minerals
Fertilizer Minerals
-
- Rock Phosphate
- Potash
- Sulphur and Pyrites
Flux and Construction Minerals
- Asbestos
- Dolomite
- Fluorspar
- Gypsum
- Wollastonite
- Non-cement grade limestone
Ceramics and Refractory Minerals
-
- Quartz and other silica minerals
- Fireclay
- China clay and Ball clay
- Magnesite
- Graphite
- Pyrophyllite
- Kyanite
- Sillimanite
- Vermiculite
- Non-metallurgical bauxite
Export Potential Minerals
- Barytes
- Bentonite
- Fuller s Earth
- Mica
- Talc, Soapstone and Steatite
Rock Phosphate
-
- Rock phosphates or phosphorites are sedimentary phosphatic deposits comprising fine-grained mixture of various calcium phosphates.
Resource distribution: The total resources of rock phosphate in India, till April 2013 are placed at 314.51 million tonnes. Of the total resources, 34% are in Jharkhand, 31% in Rajasthan, 18% in Madhya Pradesh, 8% in Uttar Pradesh & Uttarakhand each, respectively. Meagre quantities of resources are also located in Gujarat and Meghalaya.
Production: India is deficient in Rock Phosphate’s availability. In case of Rock Phosphate, production is only from two states namely Rajasthan and Madhya Pradesh.
Potash
- Potash is a common name of the fertilizer form of mineral potassium (K) which is abundantly available in nature.
Resource distribution: Rajasthan alone contributes 94% to the total resources, followed by Madhya Pradesh (5%) and Uttar Pradesh (1%)
Production: Indian reported occurrences are not commercially exploitable, and hence no production of potash is reported from India. The entire requirement of potash to be utilised as fertilizer is therefore met by imports.
Occurrences: As far as India is concerned, few deposits of potash mineral are reported from Satna & Sidhi districts of Madhya Pradesh, Sonbhadra district of Uttar Pradesh and Jaisalmer, Chittorgarh and Kota districts of Rajasthan.
Sulphur
- In India, there are no mineable elemental sulphur reserves.
- Pyrites were used as a substitute for sulphur in the manufacture of sulphuric acid. However, there was no production of pyrites since 2003.
- The domestic production of elemental sulphur is limited to by-product recoveries from petroleum refineries and fuel oil used as feedstock for manufacturing fertilizer.
Asbestos
- Asbestos is a group of six naturally occurring fibrous silicate minerals.
- It is a commercially important mineral due to its fibrous character, infusibility, low heat conductivity and high resistance to electricity & sound as also to corrosion by acids.
- It is widely used for making fire-proof cloth, rope, paper, millboard, sheeting, belt, paint, etc. and for manufacturing fireproof safes, insulators, felts, etc.
- Asbestos cement products like sheets, slates, pipes and tiles are used in the construction of buildings
Resource distribution: the total resources of asbestos in India, till April 2010 are placed at 22.17 million tonnes. Out of the total resources, Rajasthan accounts for 13.6 million tonnes (61%) and Karnataka 8.28 million tonnes (37%). The remaining two per cent resources are estimated in Jharkhand, Andhra Pradesh, Odisha and Uttarakhand.
Occurrence: asbestos deposits in India can be found in Cuddapah district in Andhra Pradesh, Singhbhum district in Jharkhand, Chikmagalur, Hassan, Mandya, Mysuru, Shivamogga districts in Karnataka, Kendujhar district in Odisha, Ajmer, Bhilwara, Dungarpur, Pali, Rajsamand, Udaipur districts in Rajasthan, Chamoli district in Uttarakhand.
Dolomite
- In commercial parlance, the rock containing 40-45% MgCO3 is usually called dolomite.
- Dolomite is used mainly in Iron and steel Industry as a fluxing agent and also used in construction Industry.
Resource distribution: Dolomite occurrences are widespread in the country. Till April 2013 total reserves/resources of dolomite are placed at 8,085 million tonnes. Major share of about 89% resources were distributed in eight states, namely, Madhya Pradesh, Chattisgarh, Gujarat, Rajasthan, Odisha, Karnataka and Maharashtra.
Production: Chhattisgarh, the leading producing state of dolomite accounted for 39% of total production in 2014-15, followed by Andhra Pradesh (11%), Karnataka (10%) Madhya Pradesh (9%), Telangana (8%), Odisha (7%), Gujarat and Rajasthan (6% each). The remaining 4% was jointly shared by Jharkhand, Maharashtra and Uttarakhand.
Occurrence: The major deposits of dolomite in India occur in Sundargarh, Sambalpur and Koraput districts in Odisha, Bastar, Bilaspur, Durg and Raigarh districts in Chhattisgarh, Singhbhum district in Jharkhand, Jaisalmer, Udaipur, Rajsamand districts in Rajasthan, Belgaum, Bagalkot, Tumkuru, Mysore districts in Karnataka, Balaghat, Chhindwara, Jabalpur, Katni, Seoni, Sagar districts in Madhya Pradesh, Anantapur, Cuddapah, Kurnool districts in Andhra Pradesh, Bhavnagar, Vadodara districts in Gujarat, Chandrapur, Nagpur, Yavatmal districts in Maharashtra and Khammam, Warangal districts in Telangana etc.
Fluorspar
- Fluorspar, also called fluorite is the mineral form of calcium fluoride, CaF2.
- Fluorspar is an indispensable flux material to aluminium metallurgy and has a variety of applications.
- Fluorspar is mainly used in chemical industry.
Resource distribution: The total resources of fluorspar in India are estimated at 18 million tonnes. By states, Gujarat and Rajasthan account for 69% and 26% of the resources respectively.
Production: The resources of fluorspar in India are limited and grades produced do not meet the specification of the chemical industry which is the bulk consumer of fluorspar.
Maharashtra State Mining Corporation (MSMC) operates Dongargaon fluorite mines in district Chandrapur, Maharashtra. GMDC mine in Gujarat is the only source of acid grade fluorspar but has high phosphorous content. Hence, requirements of domestic chemical industry are met largely by imports.
Gypsum
- It is a hydrated calcium sulphate which is used widely in the industry like portland cement, paper, paints and textile goods.
- Gypsum that occurs in nature is called mineral gypsum.
- In addition to mineral gypsum, seawater and some chemical and fertilizer plants are sources of by-product marine gypsum and by-product chemical gypsum, respectively.
Resource distribution: the total resources of mineral gypsum in India till April 2010 were estimated at 1,286 million tonnes. By States, Rajasthan alone accounts for 82% resources and Jammu & Kashmir 14% resources. The remaining 4% resources are in Tamil Nadu, Gujarat, Himachal Pradesh, Karnataka, Uttarakhand, Andhra Pradesh and Madhya Pradesh.
Production: Rajasthan continues to be the leading producer, contributing about 99% of the total output. The remaining 1% is contributed by Jammu & Kashmir.
Occurrence: major deposits of gypsum are located in Bikaner, Sri Ganganagar, Hanumangarh, Jaisalmer, Jalore, Nagaur, districts in Rajasthan, Doda, Ramban, Baramula, Uri districts in Jammu & Kashmir, Coimbatore, Erode districts in Tamilnadu, Tehri Garhwal, Dehra Dun, Mussoorie districts in Uttarakhand, and Bhavnagar, Junagarh Kachchh districts in Gujarat.
Some gypsum is also produced in Andhra Pradesh, (Nellore, Guntur, Prakasam), Himachal Pradesh (Spiti, Sirmur, Chamba), Karnataka (Gulbarga) and Madhya Pradesh (Shahdol).
Quartz and other Silica Minerals
-
- The term ‘quartz’ is often referred to as a synonym for silica.
- Silica (SiO2 ) is one of the ubiquitous materials in the earth’s crust.
- Quartz, quartz crystals, quartzite, silica sand, and (others) and moulding sand are all joined together in one generic name ‘silica minerals’.
Resource distribution: till April 2010, the total resources of quartz and silica sand in the country are estimated at 3,499 million tones. State-wise Haryana alone accounts for (52%) resources, followed by Rajasthan (9.5%), Tamil Nadu (6.53%), Maharashtra (5.05%), Jharkhand (4.4%), Andhra Pradesh (4%), Kerala (3.36%), Uttar Pradesh (3.02%), Karnataka (2.87%) and Gujarat (2.88%).
Occurrence: Khasi Hills in Meghalaya, Bundi in Rajasthan, Bankura in West Bengal, Barmer, Alwar and Nagaur in Rajasthan are major deposits of Silica Sand in India. Kurnool, Anantapur in Andhra Pradesh, Koppal in Karnataka, Tonk in Rajasthan etc. are the major deposits of Quartz.
Magnesite
- Magnesite is a carbonate of magnesium.
- It is usually found as irregular veins as an alteration product of serpentine ultramafic rocks and other magnesium-rich rock types.
Resource distribution: The total reserves/resources of magnesite till April 2013 was about 328 million tones. Substantial quantities of resources are established in Uttarakhand (71%), followed by Rajasthan (16%) and Tamil Nadu (10%). Resources are also located in Andhra Pradesh, Himachal Pradesh, Jammu & Kashmir, Karnataka and Kerala.
Production: Tamil Nadu continued to be the major producing state with a maximum share of 78% in total output during 2014-15 followed by Uttarakhand (19% ), and the remaining 3% was contributed by Karnataka.
Occurrence: Tamil Nadu has one of the largest deposits of magnesite in the world, and the largest in India are found at Chalk Hills near Salem town. Some other deposits occur in Coimbatore, Dharmapuri, Nilgiri, North Arcot Ambedkar, Periyar and Tirunelveli.
Almora, Chamoli district in Uttarakhand, Hassan, Mysore and Kodagu districts in Karnataka, Ajmer, Udaipur and Pali districts in Rajasthan, Chamba in Himachal Pradesh and Udhampur in Jammu and Kashmir also produce some magnesite.
Kyanite
- Kyanite occurs as a metamorphic aluminous rocks
- It is primarily used in metallurgical, ceramic, refractory, electrical, glass, cement and a number of other industries due to its ability to stand high temperatures.
- It is also used in making sparking plugs in automobiles.
Resource distribution: State-wise, share of Telangana is 47% of total resources followed by Andhra Pradesh 31%, Karnataka 13% and Jharkhand 6%. Remaining 3% resources are in Kerala, Maharashtra, Rajasthan, Tamil Nadu and West Bengal.
Occurrence: India has the largest deposits of kyanite in the world. Major Kyanite deposits are located in Saraikela in Jharkhand, Bhandara and Nagpur districts in Maharashtra, Chickmaglur, Chitradurga, Mandya, Mysore, Dakshin Kannad and Shimoga districts in Karnataka.
Sillimanite
- The occurrence and uses of sillimanite are almost the same as those of kyanite.
- Australia, China and India are the major producers of sillimanite.
Resource distribution: The resources are located mainly in Tamil Nadu (26%), Odisha (20%), Uttar Pradesh (17%), Andhra Pradesh (14%), Kerala (11%) and Assam (7%). Remaining 5% resources are in Jharkhand, Karnataka, Madhya Pradesh, Maharashtra, Meghalaya, Rajasthan and West Bengal.
Occurrence: major deposits of sillimanite in India are located in Ganjam district in Odisha, Kozhikode, Palakkad, Ernakulam and Kottayam districts in Kerala, Bhandara district in Maharashtra, Udaipur district in Rajasthan and Hassan, Mysore and Dakshin Kannada districts in Karnataka.
Barytes
- Barytes is a high specific gravity mineral which finds its use largely in the oil and gas well drilling.
- The largest producer is China followed by India.
Resource distribution: Among the states of Andhra Pradesh alone accounts for 94% of the country’s baryte resources. Other major deposits of barytes are found in Telangana, Rajasthan and Himachal Pradesh.
Occurrence: major deposits of Barytes in India are located in Cuddapah, Nellore districts in Andhra Pradesh, Khammam district in Telangana and Udaipur district in Rajasthan etc.
Metallic Minerals in India
- Metallic minerals are the minerals which contain one or more metallic elements. They occur in rare, naturally formed concentrations known as mineral deposits. Metallic minerals available from India are zinc, iron ore, manganese ore, gold, bauxite, silver, lead, tin, copper and chromite.
Iron Ore
Iron
India stands first in iron ore reserves in Asia. Iron ore is mainly distributed in the peninsular India.
Varieties of Iron Ore:
- Magnetite: The best quality iron ore containing 72% of pure Iron.
- Haematite: Contains 60-70% of pure Iron
- Limonite: Contains 40-60% of pure Iron
- Siderite: Contains less than 40% of pure Iron
|
St |
Mines |
Type of Iron |
Production |
|
Ka |
Chikmangalur(Bababudan Hills, Kudremukh), Bellary(Sandur) |
Haematite, Magnetite |
25% |
|
Od |
Cuttack, Keonjhar, Sundargarh (Baonaigarh), Koraput, Mayurbhanj(Badampahar) |
Haematite |
22% |
|
Ch |
Bastar(Bailadila), Durg(Dalli-Rjhara) |
Haematite |
20% |
|
Go |
North Goa |
Magnetite, Haematite |
16% |
|
Jh |
Bonai Ragne, Singhbhum, Naomandi, Daltenganj, Hazaribagh, Ranchi, Gurumahisani |
Magnetite, Haematite |
14% |
Manganese
- It is used for smelting of Iron and also for making alloys containing Manganese.
- India has second largest manganese reserves after Zimbabwe.
- India is the fifth largest producer of Manganese in the world.
- Manganese reserves in India are found in Odisha (44%), Karnataka (22%), Madhya Pradesh (13%), Maharashtra(8%) among others.
- As of 2011-12, Maharashtra is the leading producer of Manganese followed by Madhya Pradesh, Odisha and Andhra Pradesh.
Copper
- It is widely utilised by electrical industry for manufacturing wires and other electrical equipments. It is also added with gold to impart strength.
- Major share of Copper production comes from Madhya Pradesh(58%), Rajasthan(32%) and Jharkhand(11%).
- Major copper mining centres are at Singhbhum (Jharkhand), Malanjkhand(MP), Khetri-Singhana and Alwar(Rajasthan),Kho- Dariba and Delwara-Kirovli.
Bauxite
- It is the ore of Aluminium.
- Major producers of Bauxite are Kalahandi and Koraput belt of Odisha (36%), Gujarath (20%), Maharashtra (13%) and Jharkhand (13%).
- NALCO, BALCO and HINDALCO are major companies engaged in mining of Bauxite in the country.
Gold
- India’s share in the world gold production is less than one percent.
- Karnataka is the leading producer of gold accounting for 99% of total production and the rest comes from Jharkhand.
- Major gold fields in India: Kolar (Karnataka), Hutti (Karnataka), Ramgiri (Andhra Pradesh).
Other metallic minerals:
Diamond is found in Panna belt of Madhya Pradesh, Raichur-Gulbarga districts of Karnataka.
Silver is produced from Zawar mines of Udaipur district of Rajasthan.
More than 99% of Zinc production comes from Zawar area of Udaipur district of Rajasthan.
Galena, the ore of lead, is produced from Rajasthan (94%)
Odisha has the largest reserve of Nickel.
UPSC_Pre_MCQ
Which one of the following countries has replaced Italy as the major importer of bauxite from India? [1998]
(a)Canada (b)Greece (c)Ukraine (d)United Arab Emirates
Ans.(a)Canada is the largest importer of bauxite from India.
Match List-I (Ores) with List-II (States where they are mined) and select the correct answer:[1996] List-IList-II A.Manganese1.Madhya Pradesh B.Nickel2.Orissa C.Lead-zinc3.Rajasthan
D.Asbestos4.Andhra Pradesh Codes: (a) A – 1; B – 3; C – 3; D – 4 (b)A – 4; B – 3; C – 2; D – 1 (c)A – 1; B – 2; C – 3; D – 4 (d)A – 4; B – 2; C – 3; D – 1
Ans.(c)The state which produce maximum amount of metal ores are : Ores State A.Manganese1.Madhya Pradesh B.Nickel2.Orissa C.Lead-Zinc3.Rajasthan D.Asbestos4.Andhra Pradesh
Match List-I (Minerals) with List-II (Location) and select the correct answer using the codes given below: List-IList-II A.Coal1.Giridih B.Copper 2.Jayamkondam C.Manganese3.Alwar D. Lignite4.Dharwar
Codes: (a)A-1; B-4; C-3; D-2 (b)A-2; B-3; C-4; D-1 (c)A-1; B-3; C-4; D-2 (d)A-2; B-4; C-3; D-1
Ans.(c)MineralsLocation A.Coal1.Giridih B.Copper3.Alwar C.Manganese4.Dharwar D.Lignite2.Jayamkondam
In which one of the following districts, have large reserves of diamond-bearing Kimberlite been discovered in the recent past?[2007] (a)Hoshangabad (b)Raipur (c)Sambalpur (d)Warangal
Ans.(b)Payali and Behradein in Raipur, Chhattisgarh has large reserves of diamond bearing kimberlite. It has 28% of the total diamond reserve of India.
Consider the following statements:[2007] 1.Balaghat is known for its diamond mines. 2.Majhgawan is known for its manganese deposits. Which of the statements given above is/are correct? (a)1 only (b)2 only (c)Both 1 and 2 (d)Neither 1 nor 2
Ans.(d)Balaghat of Madhya Pradesh is known for its manganese mines. Majhgawan is famous for diamond.
155.Which of the following minerals found in a natural way in the state of Chhattisgarh?[2008] 1.Bauxite 2.Dolomite 3.Iron ore 4.Tin Select the correct answer using the code given below: Code: (a)1, 2 and 3 only (b)1 and 3 only (c)2 and 4 only (d)1, 2, 3 and 4
Ans.(d)The minerals deposits in Chhatisgarh is Bauxite (96 million ton), Dolomite (606 million ton) and iron ore (2336 million ton). Tin is not found in Chhatisgarh.
.
Power Generation
General Information
India is the world’s third largest producer and third largest consumer of electricity. India’s electricity sector is dominated by fossil fuels, and in particular coal, which in 2017-18 produced about three fourths of all electricity.
|
Electricity coverage |
99.7% |
|
Installed capacity |
350.162 GW |
|
Share of fossil energy |
81.9% |
|
Share of renewable energy |
15.3% |
|
GHG emissions from |
2,194.74 MtCO2 |
|
Average electricity use |
1,149 kWh |
|
Transmission & Distribution losses (2016-17) |
21.42% & 24.20% |
|
Industrial consumption (% of total, 2017-18) |
41.48% |
|
Agriculture consumption |
18.08% |
|
Commercial consumption |
5.51% |
|
Traction consumption |
1.27% |
|
Share of private sector in generation |
44% |
Thermal power
India’s electricity sector consumes about 72% of the coal produced in the country.Coal consumption by utility power is 608 million tons in 2017-18.
India has an extensive review process, one that includes environment impact assessment, prior to a thermal power plant being approved for construction and commissioning. The Ministry of Environment and Forests has published a technical guidance manual to help project proposers and to prevent environmental pollution from thermal power plants.The operating coal fired power stations both in utility and captive power sectors need to invest nearly INR 12.5 millions per MW capacity for installing pollution control equipment to comply with the latest emission norms notified by the Ministry of Environment and Forests in the year 2016. India has banned import of pet coke for using as fuel.
India, a signatory to Paris Agreement, is also reducing power generation from coal to control the emission of global warming gases.
Coal supply constraints
A large part of the Indian coal reserve is similar to Gondwana coal. It is of low calorific value and high ash content. The carbon content is low in India’s coal, and toxic trace element concentrations are negligible.
The natural fuel value of Indian coal is poor. On average, the Indian power plants using India’s coal supply consume about 0.7 kg of coal to generate a kWh, whereas United States thermal power plants consume about 0.45 kg of coal per kWh. This is because of the difference in the quality of the coal, as measured by the Gross Calorific Value (GCV). On average, Indian coal has a GCV of about 4500 Kcal/kg, whereas the quality elsewhere in the world is much better; for example, in Australia, the GCV is 6500 Kcal/kg approximately.
In the year 2017, India imported nearly 130 Mtoe (nearly 200 million tons) of steam coal and coking coal which is 29% of total consumption to meet the demand in electricity, cement and steel production.
Renewable energy
|
Type |
Capacity (in MW) |
|
Wind |
34,046.00 |
|
Solar |
21,651.48 |
|
Small Hydro Power Projects |
4,485.81 |
|
Biomass Power & Gasification and Bagasse Cogeneration |
8,700.80 |
|
Waste to Power |
138.30 |
|
Total non-conventional renewable Power – Grid Connected |
69,022.39 |
Hydro power
India is endowed with economically exploitable and viable hydro potential assessed to be about 125,570 MW at 60% load factor. India ranked fourth globally by underutilized hydro power potential.
The installed capacity as of 31 March 2018 is approximately 45,293.42 MW which is 13.17% of total installed utility capacity in India.In addition, 4486 MW capacity from Small, Mini, and Micro Hydro schemes have been installed. The public sector has a predominant share of 97% in this sector.
Hydro power
India is the 7th largest producer of hydroelectric power in the world. As of 30 April 2017, India’s installed utility-scale hydroelectric capacity was 44,594 MW, or 13.5% of its total utility power generation capacity.
India is endowed with economically exploitable and viable hydro potential assessed to be about 125,570 MW at 60% load factor. India ranked fourth globally by underutilized hydro power potential.
The installed capacity as of 31 March 2018 is approximately 45,293.42 MW which is 13.17% of total installed utility capacity in India.In addition, 4486 MW capacity from Small, Mini, and Micro Hydro schemes have been installed. The public sector has a predominant share of 97% in this sector.
Solar power
Solar power in India is a fast developing industry. The country’s solar installed capacity reached 25.21 GW as of 31 December 2018.
The Indian government had an initial target of 20 GW capacity for 2022, which was achieved four years ahead of schedule.In 2015 the target was raised to 100 GW of solar capacity (including 40 GW from rooftop solar) by 2022, targeting an investment of US$100 billion.
India expanded its solar-generation capacity 8 times from 2,650 MW on 26 May 2014 to over 20 GW as on 31 January 2018.The country added 3 GW of solar capacity in 2015-2016, 5 GW in 2016-2017 and over 10 GW in 2017-2018, with the average current price of solar electricity dropping to 18% below the average price of its coal-fired counterpart.
|
Year |
Solar power generation (TWh) |
|
2013-14 |
3.35 |
|
2014-15 |
4.60 |
|
2015-16 |
7.45 |
|
2016-17 |
12.09 |
|
2017-18 |
25.87 |
|
State |
31 March |
31 March |
31 March |
31 Dec |
|
Tel |
167.05 |
527.84 |
1,286.98 |
2,990.07 |
|
Raj |
942.10 |
1,269.93 |
1,812.93 |
2,310.46 |
|
An Pr |
137.85 |
572.97 |
1,867.23 |
2,165.21 |
|
TN |
142.58 |
1,061.82 |
1,691.83 |
1,819.42 |
|
Kar |
77.22 |
145.46 |
1,027.84 |
1,800.85 |
|
Guj |
1,000.05 |
1,119.17 |
1,249.37 |
1,344.69 |
|
MP |
558.58 |
776.37 |
857.04 |
1,210.11 |
Installed solar power capacity (MW)
Major photovoltaic (PV) power plants
|
Plant |
State |
MW |
|
|
648 |
|
||
|
221 |
|
||
|
151 |
|
||
|
143 |
|
||
|
125 |
Wind power
Wind power generation capacity in India has significantly increased in recent years. As of 31 December 2018 the total installed wind power capacity was 35.288 GW, the fourth largest installed wind power capacity in the world.
|
Financial year |
14-15 |
15-16 |
16-17 |
17-18 |
|
Installed capacity (MW) |
23,447 |
26,777 |
32,280 |
34,046 |
|
Generation (GWh) |
28,214 |
28,604 |
46,011 |
52,666 |
Installed wind power capacity and generation in India
|
State |
Total Capacity (MW) |
|
Tamil Nadu |
8,197 |
|
Gujarat |
5,613 |
|
Maharashtra |
4,784 |
|
Karnataka |
4,509 |
|
Rajasthan |
4,298 |
|
Andhra Pradesh |
3,963 |
|
Madhya Pradesh |
2,520 |
|
Telangana |
101 |
|
Kerala |
53 |
|
Others |
4 |
|
Total |
34,043 |
Installed wind capacity by state as of 31 March 2018
Wind power
Wind power generation capacity in India has significantly increased in recent years. As of 31 December 2018 the total installed wind power capacity was 35.288 GW, the fourth largest installed wind power capacity in the world.
|
Financial year |
14-15 |
15-16 |
16-17 |
17-18 |
|
Installed capacity (MW) |
23,447 |
26,777 |
32,280 |
34,046 |
|
Generation (GWh) |
28,214 |
28,604 |
46,011 |
52,666 |
UPSC_Pre_MCQ
Which of the following pairs are correctly matched? [1996] 1.Idukki : Thermal power station 2.Sabarigiri : Hydro-electric project 3.Ghatprabha: Irrigation project 4.Ramganga: Multipurpose project (a)2, 3 and 4 (b)1, 2, 3 and 4 (c)3 and 4 (d)1 and 2
Ans.(a)Idukki is a hydro-electric project of Kerala. So, the ‘1’ option is not correct.
Consider the following statements regarding power sector in India:[2001] 1.The installed capacity of power generation is around 95000 MW 2.Nuclear plants contribute nearly 15% of total power generation 3.Hydroelectricity plants contribute nearly 40% of total power generation 4.Thermal plants at present account for nearly 80% of total power generation Which of the statements is/are correct? (a)1 only (b)2 and 3 (c)3 and 4 (d)1 and 4
Ans.(a)According to the data of 2000, the power generation is 95000 MW. Nuclear plants contribute 2% of total power generation. Hydroelectricity plants contribute 25% of total production and 73% is contributed by thermal power plants.
Consider the following statements:[2004] 1.National Thermal Power Corporation has diversified into hydropower sector 2.Power Grid Corporation of India has diversified into telecom sector Which of the statements given above is/are correct? (a)1 only (b)2 only (c)Both 1 and 2 (d)Neither 1 nor 2
Ans (a)Statement ‘1’ is correct, because National Thermal Power Corporation has diversified into the hydro projects. Presently it has undertaken Koldem project in Himachal Pradesh.
Consider the following statements :[2004] 1.Indira Gandhi Centre for Atomic Research uses fast reactor technology 2.Atomic Minerals Directorate for Research and Exploration is engaged in heavy water production 3.Indian Rare Earths Limited is engaged in manufacture of Zircon for India’s Nuclear Programme beside other rare earth products Which of the statements given above are correct? (a)1, 2 and 3 (b)1 and 2 (c)1 and 3 (d)2 and 3
Ans.(a)All the statements are correct according to Atomic developments in India.
Match List-I with List-II and select the correct answer using the code given below the lists.[2005] List-I List-II (Atomic Power Plants(State) /Heavy Water Plants) A.Thal1.Andhra Pradesh B.Manuguru2.Gujarat C.Kakrapar3.Maharashtra D.Kaiga4.Rajasthan 5. Karnataka Codes : (a)A-2; B-1; C-4; D-5 (b)A-3; B-5; C-2; D-1 (c)A-2; B-5; C-4; D-1 (d)A-3; B-1; C-2; D-5
Ans.(d)Atomic Power Plant State A.ThalMaharashtra B.ManuguruAndhra Pradesh C.KakraparGujarat D.KaigaKarnataka
Match items in the List-I with List-II and select the correct answer using the codes given below the lists. [2005] List-I (Power Station)List-II (State) A.Kothagudem1.Andhra Pradesh B.Raichur2.Gujarat C.Mettur3.Karnataka D.Wanakbori4.Tamil Nadu Codes : (a)A-4; B-2; C-1; D-3 (b)A-1; B-3; C-4; D-2 (c)A-4; B-3; C-1; D-2 (d)A-1; B-2; C-4; D-3
Ans.(b)Power StationState A.Kothagudem:Andhra Pradesh B.Raichur:Karnataka C.Mettur:Tamil Nadu D.Wanakbori:Gujarat
Consider the following statements:[2006] 1.Appellate Tribunal for electricity has been established by each state government in India. 2.One of the component of the Accelerated Power Development and Reforms Programme (APDRP) is up gradation of sub-transmission and distribution system for electricity in India. Which of the statement(s) given above is/are correct? (a)1 only (b)2 only (c)Both l and 2 (d)Neither 1 nor 2
Ans.(b)By virtue of section 110 of the Electricity Act 2003, an Appellate Tribunal for Electricity having jurisdiction throughout India has been set up to hear appeals or original petitions against the order of the Adjudicating officer. But in states like Delhi and Orissa electricity has been privatized. So, the statement ‘1’ is wrong. It is not present in Jammu and Kashmir.
Where are Tapovan and Vishnugarh hydroelectric project located?[2008] (a)Madhya Pradesh (b)Uttar Pradesh (c)Uttarakhand (d)Rajasthan
Ans.(c)Tapovan and Vishnugarh hydroelectric project are located in Chamoli district of Uttarakhand.
The Dul Hasti Power Station is based on which one of the following rivers?[2009] (a)Beas (b)Chenab (c)Ravi (d)Sutlej
Ans.(b)The Dul Hasti Power Station is on the Chenab river in Jammu and Kashmir.
Which of the following is/are the characteristic/characteristics of Indian coal?[2013 – I] 1.High ash content 2.Low sulphur content 3.Low ash fusion temperature Select the correct answer using the codes given below. (a)1 and 2 only (b)2 only (c)1 and 3 only (d)1, 2 and 3
Ans.(a)Indian coal has high ash content and low calorific value. It has low sulphur and low phosphorous content but high ash fusion temperature.
.