Power Generation
General Information
India is the world’s third largest producer and third largest consumer of electricity. India’s electricity sector is dominated by fossil fuels, and in particular coal, which in 2017-18 produced about three fourths of all electricity.
|
Electricity coverage |
99.7% |
|
Installed capacity |
350.162 GW |
|
Share of fossil energy |
81.9% |
|
Share of renewable energy |
15.3% |
|
GHG emissions from |
2,194.74 MtCO2 |
|
Average electricity use |
1,149 kWh |
|
Transmission & Distribution |
21.42% & 24.20% |
|
Industrial consumption |
41.48% |
|
Agriculture consumption |
18.08% |
|
Commercial consumption |
5.51% |
|
Traction consumption |
1.27% |
|
Share of private sector in generation |
44% |
Installed capacity by source in India
as on 31 March 2020
Coal: 205,344.5 MW (55.5%)
Large Hydro: 45,699.22 MW (12.3%)
Small Hydro: 4,683.16 MW (1.3%)
Wind Power: 37,669.25 MW (10.2%)
Solar Power: 34,405.67 MW (9.3%)
Biomass: 10,001.11 MW (2.7%)
Nuclear: 6,780 MW (1.8%)
Gas: 24,955.36 MW (6.7%)
Diesel: 509.71 MW (0.1%)
Total installed utility power capacity by sector and type
|
Sector |
Total (MW) |
% |
|
State |
102,817.61 |
29 |
|
Central |
90,176.93 |
25 |
|
Private |
167,461.82 |
46 |
|
All India |
360,456.37 |
100 |
Per-Capita Electricity consumption (kWh)
in 2016-2017
| State/Union territory | Per-Capita Consumption |
| (kWh/year) | |
| D&N Haveli | 15,783 |
| Daman and Diu | 7,965 |
| Goa | 2,466 |
| Gujarat | 2,279 |
| Chhattisgarh | 2,016 |
| Maharashtra | 1,307 |
| Madhya Pradesh | 989 |
| Puducherry | 1,784 |
| Tamil Nadu | 1,847 |
| Andhra Pradesh | 1,319 |
| Telangana | 1,551 |
| Karnataka | 1,367 |
| Kerala | 763 |
| Lakshadweep | 633 |
| Punjab | 2,028 |
| Haryana | 1,975 |
| Delhi | 1,574 |
| Himachal Pradesh | 1,340 |
| Uttarakhand | 1,454 |
| Chandigarh | 1,128 |
| J & K | 1,282 |
| Rajasthan | 1,166 |
| Uttar Pradesh | 585 |
| Odisha | 1,622 |
| Sikkim | 806 |
| Jharkhand | 915 |
| West Bengal | 665 |
| A&N | 370 |
| Bihar | 272 |
| Arunachal Pradesh | 648 |
| Meghalaya | 832 |
| Mizoram | 523 |
| Nagaland | 345 |
| Tripura | 470 |
| Assam | 339 |
| Manipur | 326 |
| National | 1,122 |
Rural and Urban electrification
India’s Ministry of Power launched Deen Dayal Upadhyaya Gram Jyoti Yojana (DDUGJY) as one of its flagship programmes in July 2015 with the objective of providing round the clock power to rural areas. The programme focused on reforms in the rural power sector by separating feeder lines for rural households from those for agricultural applications, and strengthening transmission and distribution infrastructure.
A previous scheme for rural electrification, Rajiv Gandhi Grameen Vidyutikaran Yojana (RGGVY) was subsumed into the new scheme. As of 28 April 2018, 12 days ahead of the target date, all Indian villages (a total of 597,464 census villages) were electrified.
India has also achieved close to 100% electrification of all rural and urban households. As of 4 January 2019, 211.88 million rural households were provided with electricity, close to 100% of the 212.65 million total rural households. As of 4 January 2019, 42.937 million urban households are provided with electricity, close to 100% of the 42.941 million total urban households.
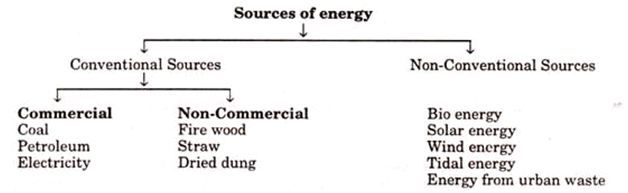
The two major sources of energy can be classified under:
- Conventional Sources
- Non-Conventional Sources
Below you could see the difference between conventional and non-conventional sources of energy.
Thermal power
India’s electricity sector consumes about 72% of the coal produced in the country.Coal consumption by utility power is 608 million tons in 2017-18.
Growth of Installed Capacity in India
India has an extensive review process, one that includes environment impact assessment, prior to a thermal power plant being approved for construction and commissioning. The Ministry of Environment and Forests has published a technical guidance manual to help project proposers and to prevent environmental pollution from thermal power plants.The operating coal fired power stations both in utility and captive power sectors need to invest nearly INR 12.5 millions per MW capacity for installing pollution control equipment to comply with the latest emission norms notified by the Ministry of Environment and Forests in the year 2016. India has banned import of pet coke for using as fuel.
India, a signatory to Paris Agreement, is also reducing power generation from coal to control the emission of global warming gases.
Coal supply constraints
A large part of the Indian coal reserve is similar to Gondwana coal. It is of low calorific value and high ash content. The carbon content is low in India’s coal, and toxic trace element concentrations are negligible.
The natural fuel value of Indian coal is poor. On average, the Indian power plants using India’s coal supply consume about 0.7 kg of coal to generate a kWh, whereas United States thermal power plants consume about 0.45 kg of coal per kWh. This is because of the difference in the quality of the coal, as measured by the Gross Calorific Value (GCV). On average, Indian coal has a GCV of about 4500 Kcal/kg, whereas the quality elsewhere in the world is much better; for example, in Australia, the GCV is 6500 Kcal/kg approximately.
In the year 2017, India imported nearly 130 Mtoe (nearly 200 million tons) of steam coal and coking coal which is 29% of total consumption to meet the demand in electricity, cement and steel production.
Hydro power
Classification of Hydro Projects based on Installed Capacity
Hydro power projects are generally categorized in two segments i.e. small and large hydro. In India, hydro projects up to 25 MW station capacities have been categorized as Small Hydro Power (SHP) projects.
- Micro: upto 100 KW
- Mini: 101 KW to 2 MW
- Small: 2 MW to 25 MW
- Mega: Hydro projects with installed capacity >= 500 MW
- Thermal Projects with installed capacity >=1500 MW
While Ministry of Power, Government of India is responsible for large hydro projects, the mandate for the subject small hydro power (up to 25 MW) is given to Ministry of New and Renewable Energy
Advantages of hydropower
- Hydropower is a renewable source of energy because it uses and not consumes the water for generation of electricity, and the hydropower leaves this vital resource available for other uses.
- It is a renewable source of energy with no consumables involved; there is very little recurring cost and hence no high long term expenditure. It is cheaper as compared to electricity generated from coal and gas fired plants. It also reduces the financial losses due to frequency fluctuations and it is more reliable as it is inflation free due to not usage of fossil fuel.
- Hydropower stations are preferred solution for meeting peak loads in grids due to its unique capabilities of quick starting and closing.
- The operational needs of hydro & thermal stations are complimentary and the balanced mix helps in optimal utilization of the capacity. Seasonal load curves of regional grids match with the pattern of hydro power generation. During summer/monsoon season when the generation at hydro power plants is high, the load factor of the system is high due to heavy agricultural load. During winter, the thermal stations operating at base load and hydro stations working as peak load stations will take care of weather beating loads.
Challenges related to hydropower
- The hydropower generation is highly capital-intensive mode of electricity generation.
- Due to the fact that hydropower projects are primarily located in hilly areas, where forest cover is comparatively better than plain areas, diversion of forest land is sometimes unavoidable.
- Submergence of land, thereby loss of flora and fauna and large scale displacement, due to the hydropower projects
Hydropower potential in India
The hydropower potential of India is around 1,45,000 MW and at 60% load factor, it can meet the demand of around 85, 000 MW. The estimated potential for power generation from Small hydropower projects is about 20,000 MW.
India is endowed with economically exploitable and viable hydro potential assessed to be about 125,570 MW at 60% load factor. India ranked fourth globally by underutilized hydro power potential.
The installed capacity as of 31 March 2018 is approximately 45,293.42 MW which is 13.17% of total installed utility capacity in India.In addition, 4486 MW capacity from Small, Mini, and Micro Hydro schemes have been installed. The public sector has a predominant share of 97% in this sector.
Hydro power Production
India is the 7th largest producer of hydroelectric power in the world. As of 30 April 2017, India’s installed utility-scale hydroelectric capacity was 44,594 MW, or 13.5% of its total utility power generation capacity.
India is endowed with economically exploitable and viable hydro potential assessed to be about 125,570 MW at 60% load factor. India ranked fourth globally by underutilized hydro power potential.
The installed capacity as of 31 March 2018 is approximately 45,293.42 MW which is 13.17% of total installed utility capacity in India.In addition, 4486 MW capacity from Small, Mini, and Micro Hydro schemes have been installed. The public sector has a predominant share of 97% in this sector.
Unconventional Power
India’s renewable energy sector has been growing vigorously for the last decade. As of 31 March 2018, India had grid-connected installed electricity generation capacity of about 69.02 GW from non-conventional renewable technologies and conventional renewable power or major hydroelectric power capacity of 45.29 MW.
Installed capacity of non-conventional renewable power
| Type | Capacity (in MW) |
|---|---|
| Wind | 34,046.00 |
| Solar | 21,651.48 |
| Small Hydro Power Projects | 4,485.81 |
| Biomass Power | 8,700.80 |
| Waste to Power | 138.30 |
| Total | 69,022.39 |
Solar power

Solar power in India is a fast developing industry. The country’s solar installed capacity reached 25.21 GW as of 31 December 2018.
The Indian government had an initial target of 20 GW capacity for 2022, which was achieved four years ahead of schedule.In 2015 the target was raised to 100 GW of solar capacity (including 40 GW from rooftop solar) by 2022, targeting an investment of US$100 billion.
India expanded its solar-generation capacity 8 times from 2,650 MW on 26 May 2014 to over 20 GW as on 31 January 2018.The country added 3 GW of solar capacity in 2015-2016, 5 GW in 2016-2017 and over 10 GW in 2017-2018, with the average current price of solar electricity dropping to 18% below the average price of its coal-fired counterpart.
|
Year |
Solar power |
|
2013-14 |
3.35 |
|
2014-15 |
4.60 |
|
2015-16 |
7.45 |
|
2016-17 |
12.09 |
|
2017-18 |
25.87 |
Installed solar power capacity (MW)
|
State |
31 March |
31 March |
31 March |
31 Dec |
|
Tel |
167.05 |
527.84 |
1,286.98 |
2,990.07 |
|
Raj |
942.10 |
1,269.93 |
1,812.93 |
2,310.46 |
|
An Pr |
137.85 |
572.97 |
1,867.23 |
2,165.21 |
|
TN |
142.58 |
1,061.82 |
1,691.83 |
1,819.42 |
|
Kar |
77.22 |
145.46 |
1,027.84 |
1,800.85 |
|
Guj |
1,000.05 |
1,119.17 |
1,249.37 |
1,344.69 |
|
MP |
558.58 |
776.37 |
857.04 |
1,210.11 |
Major photovoltaic (PV) power plants
|
Plant |
State |
MW |
|
|
648 |
|||
|
221 |
|||
|
151 |
|||
|
143 |
|||
|
125 |
Wind power
Generation of electricity has emerged as the most important application of wind energy world-wide. The concept is simple: flowing wind rotates the blades of a turbine, and causes electricity to be produced in generator unit. The blades and generator (housed in a unit called ‘nacelle’) are mounted at the top of a tower.
Technology
Wind turbines generally have three rotor blades, which rotate with wind flow and are coupled to a generator either directly or through a gear box. The rotor blades rotate around a horizontal hub connected to a generator, which is located inside the nacelle. The nacelle also houses other electrical components and the yaw mechanism, which turns the turbine so that it faces the wind. Sensors are used to monitor wind direction and the tower head is turned to line up with the wind. The power produced by the generator is controlled automatically as wind speeds vary. The rotor diameters vary from 30 metres (m) to about 90 m, whereas the towers on which the wind electric generators (WEGs) are mounted, range in height from 25 to 80 m. The power generated by wind turbines is conditioned properly so as to feed the local grid. The unit capacities of WEGs presently range from 225 kilowatt (kW) to 2 megawatt (MW), and they can operate in wind speeds ranging between 2.5 m/s (metres per second) and 25 m.
Establishment of wind mills
Wind speed data of potential locations is compiled for a period of one to two years, to identify suitable sites for the installation of WEGs. Thereafter, WEGs are installed on the sites with appropriate distances between them to ensure minimum disturbance to one another. After the identification of sites, wind turbines generally take two to three months for installation. The equipment is tested and certified by agencies to ensure that it conforms to the laid-down standards, specifications, and performance parameters. The machines are maintained by the respective manufacturers after installation.
Cost of wind power projects
The cost of wind power generation varies between Rs 4 and 5 crores per MW, depending upon state characteristics. The machines can be maintained at a cost of Rs 0.25 to 0.60/kWh. The projects are estimated to have a pay-back period of five to eight years.
Wind power generation
Wind power generation capacity in India has significantly increased in recent years. As of 31 December 2018 the total installed wind power capacity was 35.288 GW, the fourth largest installed wind power capacity in the world.
|
Financial year |
14-15 |
15-16 |
16-17 |
17-18 |
|
Installed capacity (MW) |
23,447 |
26,777 |
32,280 |
34,046 |
|
Generation (GWh) |
28,214 |
28,604 |
46,011 |
52,666 |
Installed wind power capacity and generation in India
|
State |
Total Capacity (MW) |
|
Tamil Nadu |
8,197 |
|
Gujarat |
5,613 |
|
Maharashtra |
4,784 |
|
Karnataka |
4,509 |
|
Rajasthan |
4,298 |
|
Andhra Pradesh |
3,963 |
|
Madhya Pradesh |
2,520 |
|
Telangana |
101 |
|
Kerala |
53 |
|
Others |
4 |
|
Total |
34,043 |
Biomass- based power generation
India produces a huge quantity of biomass material in its agricultural, agro-industrial, and forestry operations. According to some estimates, over 500 million tonnes of agricultural and agro-industrial residue alone is generated every year. This quantity, in terms of heat content, is equivalent to about 175 million tonnes of oil. A portion of these materials is used for fodder and fuel in the rural economy. However, studies have indicated that at least 150–200 million tonnes of this biomass material does not find much productive use, and can be made available for alternative uses at an economical cost. These materials include a variety of husks and straws. This quantity of biomass is sufficient to generate 15 000–25 000 MW of electrical power. In addition, electricity can also be generated from biomass grown on wastelands, road and rail track side plantations, etc. The quantum of electricity that can be produced from such biomass has been estimated to be in excess of 70 000 MW. Thus, the total electricity generation potential from biomass could reach a figure of about 100 000 MW.
Technology used for biomass based power generation
The technology for generation of electricity from these biomass materials is similar to the conventional coal-based thermal power generation. The biomass is burnt in boilers to generate steam, which drives a turbo alternator for generation of electricity.
Advantages
- These projects can be designed to match the electric loads as biomass can be stored and used according to demand.
- Equipment for these projects is similar to that for coal-based thermal power projects and hence, no new technological developments are required.
- Due to their proximity to the rural areas, these projects are likely to improve quality of electricity supply there.
- A variety of biomass materials can be used in the same plant, providing flexibility of operations.
Cost
Typical capital costs for biomass power projects range from Rs 3 crores/ MW to Rs 4 crores/MW. Costs of generation depend upon the cost of biomass, the plant load factor, and the efficiencies of conversion.Biomass Gasification for Thermal and Electrical Applications
Geothermal energy
Geothermal energy is thermal energy generated and stored in the Earth. India’s geothermal energy installed capacity is experimental, and commercial use is insignificant. According to some estimates, India has 10,600 MW of geothermal energy available. The resource map for India has been grouped into six geothermal provinces:
- Himalayan Province – Tertiary orogenic belt with tertiary magmatism
- Faulted blocks province – the Aravalli range, Naga-Lushi, the west coast regions, and the Narmada–Son lineament.
- Volcanic arc province – the Andaman and Nicobar arc.
- Deep sedimentary basins of Tertiary age such as the Cambay basin.
- Radioactive province – Surajkund, Hazaribagh and Jharkhand.
- Cratonic province – Peninsular India
India has about 340 hot springs spread over the country. Of these, 62 are distributed along the northwest Himalaya, in the states of Jammu and Kashmir, Himachal Pradesh and Uttarakhand. They are found concentrated in a 30-50-km wide thermal band mostly along the river valleys. The Naga-Lusai and West Coast Provinces also manifest a series of thermal springs. The Andaman and Nicobar arc is the only place in India where volcanic activity continues, potentially a good site for geothermal energy. The Cambay geothermal belt is 200 km long and 50 km wide, with Tertiary sediments. Thermal springs have been reported from the belt although they are not of very high temperature or flow levels. High subsurface temperature and thermal fluid have been reported in deep drill wells in depth ranges of 1.7 to 1.9 km during drilling in this area. Steam blowout has also been reported in drill holes in a depth range of 1.5 to 3.4 km. The thermal springs in India’s peninsular region are more related to the faults, which allow water to circulate to considerable depths. The circulating water acquires heat from the normal thermal gradient in the area, and can emerge at a high temperature.
In a December 2011 report, India identified six promising geothermal sites for the development of geothermal energy. In decreasing order of potential, these are:
- Tattapani (Chhattisgarh)
- Puga (Jammu & Kashmir)
- Cambay Graben (Gujarat)
- Manikaran (Himachal Pradesh)
- Surajkund (Haryana)
- Chhumathang (Jammu & Kashmir)
Puga was chosen for the first geothermal plant, but as of December 2017 little progress had been made.
Tidal power
Total identified potential of Tidal Energy is about 9000 MW in West Coast Gulf of Cambay (7000 MW), Gulf of Kutch (1200 MW) and in East Coast the Ganges Delta in the Sunderbans in West Bengal for small scale tidal power development estimates the potential in this region to be about 100 MW.
In 2011, Government of Gujarat signed MOU for establishing a 250 MW tidal power project in Gulf of Kutch with GPCL, Atlantis Resource Corporation (U.K) and PMES, Singapore. A 50 MW tidal power project at Mandavi in kutchh district has been initiated in first phase.
The Ministry of New & Renewable Energy (MNRE) in 2008, sanctioned a demonstration project for setting up a 3.75 MW tidal power plant at Durgaduani Creek in Sunderbans, West Bengal but due to some reason it could not see the light of the day.
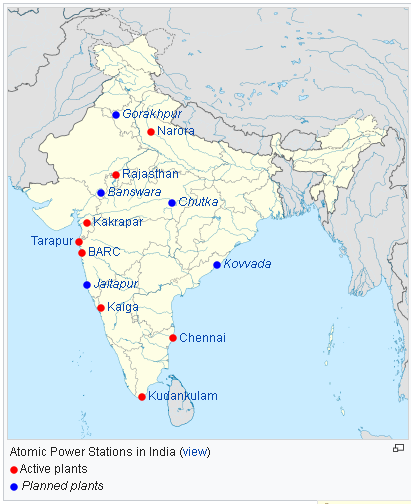
Nuclear power
Nuclear power is the fourth -largest source of electricity in India after thermal, hydroelectric and renewable sources of electricity. As of March 2017, India has 22 nuclear reactors in operation at seven sites, having an installed capacity of 6780 MW. and producing a total of 30,292.91 GWh of electricity 11 more reactors are under construction to generate an additional 8,100 MW.
All the twenty two nuclear power reactors with an installed capacity of 6,780 MW equal to 2.0% of total installed utility capacity, are operated by the Nuclear Power Corporation of India. India ranked seventh in number of operated reactors (22) and fourteenth in total installed capacity.
| Power station | Est | Location | State | Installed Capacity |
| (MW) | ||||
| Tarapur Atomic Power Station | 1969 | Tarapur | Mah | |
| Kakrapar Atomic Power Station | 1993 | Kakrapar | Gujarat | 440 |
| Western | 2 | 1,840 | ||
| Kudankulam Nuclear Power Plant | 2013 | Kudankulam | TN | 2,000 |
| Kaiga Nuclear Power Plant | 2000 | Kaiga | Karnataka | 880 |
| Madras Atomic Power Station | 1984 | Kalpakkam | TN | 440 |
| Southern | 3 | 3,320 | ||
| Rajasthan Atomic Power Station | 1973 | Rawatbhata | Rajasthan | 1,080 |
| Rajasthan Atomic Power Station | 1973 | Rawatbhata | Rajasthan | – |
| Narora Atomic Power Station | 1991 | Narora | Uttar Pradesh | 440 |
| Gorakhpur Nuclear Power Plant | Fatehabad | Haryana | – | |
| Northern | 3 | 1520 | ||
| TOTAL | 8 | 6,680 |
Government Schemes
Deendayal Upadhyaya Gram Jyoti Yojana (DDUGJY)
The rural electrification scheme provides for (a) separation of agriculture and non-agriculture feeders; (b) strengthening and augmentation of sub-transmission and distribution infrastructure in rural areas including metering at distribution transformers, feeders and consumers end.
Integrated Power Development Scheme (IPDS)
The scheme provides for (a) strengthening of sub-transmission and distribution networks in urban areas; (b) metering of distribution transformers/feeders/consumers in urban areas; and (c) IT enablement of distribution sector and strengthening of distribution network.
Ujwal Discom Assurance Yojana (UDAY)
The scheme has been launched for operational and financial turnaround of Discoms.
‘4 Es’ in the revised Tariff Policy: The 4Es include Electricity for all, Efficiency to ensure affordable tariffs, Environment for a sustainable future, Ease of doing business to attract investments and ensure financial viability.
GARV (Grameen Vidyutikaran) App
To monitor transparency in implementation of the electrification schemes, Grameen Vidyut Abhiyantas (GVAs) have been appointed by the government to report progress through GARV app.
UJALA and SLNP
The Union government’s Unnat Jyoti by Affordable LEDs for All (UJALA) and LED Street Lighting National Programme (SLNP), marked their fifth anniversary on 5th January 2020.
Both schemes have been spearheaded and implemented by Energy Efficiency Services Limited (EESL), a joint venture of PSUs under the Ministry of Power, Government of India.
These programmes have bagged global awards like the South Asia Procurement Innovation Award (SAPIA) 2017, CIO 100 award 2019, the Global Solid State Lighting (SSL) award of excellence.
Key Points
Unnat Jyoti by Affordable LEDs for All
It was launched in 2015 with a target of replacing 77 crore incandescent lamps with LED bulbs and to nullify the high-cost of LEDs that acted as a barrier previously in the adoption of energy-efficient systems.
The scheme was implemented to set up a phase-wise LED distribution.
The objective is to promote efficient lighting, enhance awareness on using efficient equipment that will reduce electricity bills and preserve the environment.
It is the world’s largest domestic lighting project.
Achievements
Through the UJALA initiative, over 36.13 crore LED bulbs have been distributed across India. This has resulted in an estimated energy savings of 46.92 billion kWh per year, avoided peak demand of 9,394 MW, and an estimated greenhouse gas (GHG) emission reduction of 38 million tons of CO2 annually.
The reduced electricity bills add to a household’s disposable income and lifetime savings, thus improving the quality of life, generating prosperity in local communities and in expanding energy access to all.
Apart from this, the Government of India initiated the Gram Swaraj Abhiyan (GSA) in 2018, which was aimed at the promotion of social harmony by appraising rural communities of various government welfare schemes and initiatives. As a part of it, villages with poor households were able to buy LED bulbs for a special price under UJALA programme.
National Energy Policy.
The 2017 National Energy Policy (NEP), drafted by the NITI Aayog, takes the baton forward from the 2006 Integrated Energy Policy (IEP) in setting the trajectory of growth for the energy sector.
Key Objectives of NEP:
There are four key objectives of National Energy Policy.
Access at affordable prices,
Improved security and Independence
Greater Sustainability and
Economic Growth.
Targets of National Energy Policy:
The intention of the National Energy Policy is to present a broad framework for the overall energy sector, taking into account the multiple technology and fuel options.
All the Census villages are planned to be electrified by 2018, and universal electrification is to be achieved, with 24×7 electricity by 2022.
The share of manufacturing in our GDP is to go up to 25% from the present level of 16%, while the Ministry of Petroleum is targeting reduction of oil imports by 10% from 2014-15 levels, both by 2022.
INDC (Intended Nationally Determined Contributions) target at reduction of emissions intensity by 33 percent-35 percent by 2030 over 2005.
Achieving a 175 GW renewable energy capacity by 2022, and share of non-fossil fuel based capacity in the electricity mix is aimed at above 40% by 2030.
NITI Aayog’s National Energy Policy is aimed at curbing imports by increasing production of renewable energy in the country fivefold to 300 billion units by 2019 and tripling coal production to 1.5 billion tonnes.
Coal imports are envisaged to come down by 10% by 2022 and by 50% by 2030.
This policy will replace the Integrated Energy Policy of the previous government.
Policy focus on clean energy resources such as solar and natural gas
NITI aayog also plans to set up the National Energy Data Agency on the lines of the US Energy Information Administration (EIA).
Agency will aim to provide oil and gas mapping by working with the Directorate General of Hydrocarbons, transmission line mapping, energy demand mapping and solar irradiation mapping, among others.
Need for NEP:
Energy is acknowledged as a key input towards raising the standard of living of citizens of any country, as is evident from the correlation between per capita electricity consumption and Human Development Index (HDI).
Accordingly, energy policies of India have over the years directly aimed to raise per capita energy consumption, even while the main focus of the country’s development agenda has been on eradication of poverty.
While India strives to achieve a double digit growth rate in its national income, it is equally important that clean energy is available to all the citizens.
The NEP draft comes at a time when the energy sector is seeking clarity. In the face of claims of surplus power, even as rampant energy poverty continues to plague the country, the sector needs clear signals of the future pathways.
IEP 2006 Vs. NEP 2017
The Integrated Energy Policy of 2006 is the base of the current National Energy Policy drafted by the NITI Aayog.
The primary difference between the two policies is the approach used to achieve the objectives, the IEP made a basket of specific measures which were to be used to achieve the goals.
In the case of NEP, a broad framework for the entire energy sector is considered including vast technology and various fuel options.
The transition from IEP to NEP is important to check the sudden decline in the renewable energy tariffs and to scale up the grid-connected to clean energy sources.
India Vision 2040
The NEP aims at supporting the Indian ambition to emerge as a well-developed and resilient economy with high level of human development.
Additionally, it helps prepare the nation to anticipate the technological and market related changes in the energy sector.
Issues with the draft NEP 2017
The NITI Aayog claims that over a period of time India will become a net exporter of coal at a time when most of the countries are shunning coal based energy plants for clean and environment-friendly energy plants.
The consumption of coal has been estimated to grow to around 330-441 GW by the year 2040 which contradicts the aim to shift towards renewable sources of energy like wind and solar plants.
Also at a time when the tariffs of solar and wind energy are at an all time low growing dependency nullify the motive behind adopting environment-friendly energy sources.
The draft instead of phasing out the existing thermal power plants focuses more on relocating the existing plants in places where do not affect human habitations to an extent of causing serious damage.
There is also some amount of repetition in the current draft. Promoting LPG imports and providing incentives for shale and conventional gas exploration have already been proposed in previous policies.
There needs to be more strict and strong action proposed for pipelines like the Ira-Pakistan India (IPI) and Turkmenistan- Afganistan- Pakistan- India as there has been little progress in the past 20 years on them.
UPSC_Pre_MCQ
Which of the following pairs are correctly matched? [1996] 1.Idukki : Thermal power station 2.Sabarigiri : Hydro-electric project 3.Ghatprabha: Irrigation project 4.Ramganga: Multipurpose project (a)2, 3 and 4 (b)1, 2, 3 and 4 (c)3 and 4 (d)1 and 2
Ans.(a)Idukki is a hydro-electric project of Kerala. So, the ‘1’ option is not correct.
Consider the following statements regarding power sector in India:[2001] 1.The installed capacity of power generation is around 95000 MW 2.Nuclear plants contribute nearly 15% of total power generation 3.Hydroelectricity plants contribute nearly 40% of total power generation 4.Thermal plants at present account for nearly 80% of total power generation Which of the statements is/are correct? (a)1 only (b)2 and 3 (c)3 and 4 (d)1 and 4
Ans.(a)According to the data of 2000, the power generation is 95000 MW. Nuclear plants contribute 2% of total power generation. Hydroelectricity plants contribute 25% of total production and 73% is contributed by thermal power plants.
Consider the following statements:[2004] 1.National Thermal Power Corporation has diversified into hydropower sector 2.Power Grid Corporation of India has diversified into telecom sector Which of the statements given above is/are correct? (a)1 only (b)2 only (c)Both 1 and 2 (d)Neither 1 nor 2
Ans (a)Statement ‘1’ is correct, because National Thermal Power Corporation has diversified into the hydro projects. Presently it has undertaken Koldem project in Himachal Pradesh.
Consider the following statements :[2004] 1.Indira Gandhi Centre for Atomic Research uses fast reactor technology 2.Atomic Minerals Directorate for Research and Exploration is engaged in heavy water production 3.Indian Rare Earths Limited is engaged in manufacture of Zircon for India’s Nuclear Programme beside other rare earth products Which of the statements given above are correct? (a)1, 2 and 3 (b)1 and 2 (c)1 and 3 (d)2 and 3
Ans.(a)All the statements are correct according to Atomic developments in India.
Match List-I with List-II and select the correct answer using the code given below the lists.[2005] List-I List-II (Atomic Power Plants(State) /Heavy Water Plants) A.Thal1.Andhra Pradesh B.Manuguru2.Gujarat C.Kakrapar3.Maharashtra D.Kaiga4.Rajasthan 5. Karnataka Codes : (a)A-2; B-1; C-4; D-5 (b)A-3; B-5; C-2; D-1 (c)A-2; B-5; C-4; D-1 (d)A-3; B-1; C-2; D-5
Ans.(d)Atomic Power Plant State A.ThalMaharashtra B.ManuguruAndhra Pradesh C.KakraparGujarat D.KaigaKarnataka
Match items in the List-I with List-II and select the correct answer using the codes given below the lists. [2005] List-I (Power Station)List-II (State) A.Kothagudem1.Andhra Pradesh B.Raichur2.Gujarat C.Mettur3.Karnataka D.Wanakbori4.Tamil Nadu Codes : (a)A-4; B-2; C-1; D-3 (b)A-1; B-3; C-4; D-2 (c)A-4; B-3; C-1; D-2 (d)A-1; B-2; C-4; D-3
Ans.(b)Power StationState A.Kothagudem:Andhra Pradesh B.Raichur:Karnataka C.Mettur:Tamil Nadu D.Wanakbori:Gujarat
Consider the following statements:[2006] 1.Appellate Tribunal for electricity has been established by each state government in India. 2.One of the component of the Accelerated Power Development and Reforms Programme (APDRP) is up gradation of sub-transmission and distribution system for electricity in India. Which of the statement(s) given above is/are correct? (a)1 only (b)2 only (c)Both l and 2 (d)Neither 1 nor 2
Ans.(b)By virtue of section 110 of the Electricity Act 2003, an Appellate Tribunal for Electricity having jurisdiction throughout India has been set up to hear appeals or original petitions against the order of the Adjudicating officer. But in states like Delhi and Orissa electricity has been privatized. So, the statement ‘1’ is wrong. It is not present in Jammu and Kashmir.
Where are Tapovan and Vishnugarh hydroelectric project located?[2008] (a)Madhya Pradesh (b)Uttar Pradesh (c)Uttarakhand (d)Rajasthan
Ans.(c)Tapovan and Vishnugarh hydroelectric project are located in Chamoli district of Uttarakhand.
The Dul Hasti Power Station is based on which one of the following rivers?[2009] (a)Beas (b)Chenab (c)Ravi (d)Sutlej
Ans.(b)The Dul Hasti Power Station is on the Chenab river in Jammu and Kashmir.
Which of the following is/are the characteristic/characteristics of Indian coal?[2013 – I] 1.High ash content 2.Low sulphur content 3.Low ash fusion temperature Select the correct answer using the codes given below. (a)1 and 2 only (b)2 only (c)1 and 3 only (d)1, 2 and 3
Ans.(a)Indian coal has high ash content and low calorific value. It has low sulphur and low phosphorous content but high ash fusion temperature.
.
Industries
EVOLUTION
Industrial development is considered as one of the important indicators of socioeconomic and human development. Before the rise of modern industries, India was known all over the world for its cottage and household industries. Indian muslin, silk goods, and artistic pottery were in great demand the world over.
The arrival of English resulted in the decay of traditional handicrafts. The East India Company developed a policy of export of raw material from India to Britain and the import of finished products to India from Europe. It was because of this policy that no industry could be developed in India before 1854.
The industrial development in India started after 1854 when some cotton and jute mills were established by the British in Mumbai and Calcutta (Kolkata) respectively. The cotton textile industry expanded during 1870s when there was civil war in America.
After the First World War, the Indian industries got:a good boost as India became the main supplier of cotton and woollen textiles and liquors. The government gave protection to some of the industries.
The period during the Second World War was a time of crisis as India got involved into war. After the Second World War, the production fell down due to decreasing demand for industrial products, lack of capital, political unrest, transport bottlenecks, and labour strikes.
Location Factors
Industrial locations are complex in nature. These are influenced by the availability of many factors. Some of them are: raw material, land, water, labor, capital, power, transport, and market.
Geographical Factors
- Raw material: Availability of natural resource that can be used as raw material.
- Technology: To turn the resource into an asset with value.
- Power: To utilize the technology.
- Labour: Human resource in the area who can function as labor to run the processes.
- Transport : Road/rail connectivity.
- Storage and warehousing.
- Marketing feasibility.
- Characteristics of land and soil.
- Climate.
- Precipitation and water resources.
- Vulnerability to natural resources.
Non-geographical Factors
- Capital investment.
- Availability of loans.
- Investment climate.
- Government policies/regulations.
- Influence of pressure groups.
Major Industrial Regions
India has several industrial regions like Mumbai- Pune cluster, Bangalore-Tamil Nadu region, Hugli region, Ahmedabad-Baroda region, Chottanagpur industrial belt, Vishakhapatnam-Guntur belt, Gurgaon-Delhi-Meerut region and the Kollam Thiruvanathapuram industrial cluster. The Industrial region are discussed below:
1. Mumbai-Pune Industrial Region
It extends from Mumbai-Thane to Pune and in adjoining districts of Nashik and Solapur. Besides, industrial development has been rapid in Kolaba, Ahmednagar, Satara, Sangli and Jalgaon districts. Development of this region started with the location of cotton textile industry in Mumbai. Mumbai, with cotton hinterland and moist climate favoured the location of cotton textile industry. Hydro-electricity was developed in the Western Ghats region to meet the requirements of this industry. With the development of cotton textile industry, chemical industry also developed. Important industrial centres are Mumbai, Kolaba, Kalyan, Thane, Trombay, Pune, Pimpri, Nashik, Manmad, Solapur, Kolhapur, Ahmednagar, Satara and Sangli.
2. Hugli Industrial Region
It extends from Bansberia in the north to Birlanagar in the south for a distance of about 100 km along the Hugli River. Industries also has developed in Mednipur in the west. Kolkata-Haora from the nucleus of this industrial region. Kolkata emerged as a leading centre of the country. Later, Kolkata was connected with interior parts by railway lines and road routes. Development of tea plantations in Assam and northern hills of West Bengal, the processing of indigo earlier and jute later coupled with the opening of coalfields of the Damodar Valley and iron ore deposits of the Chotanagpur plateau, contributed to the industrial development of the region. Cheap labour available from thickly populated part of Bihar, eastern Uttar Pradesh and Orissa also contributed to its development.
Cotton textile industry also grew along with jute industry, paper, engineering, textile machinery, electrical, chemical, pharmaceuticals, fertiliser and petrochemical industries have also developed within this region. Important industrial centres of this region are Kolkata, Haora, Haldia, Serampur, Rishra, Shibpur, Naihati, Kakinara, Shamnagar, Titagarh, Sodepur, Budge Budge, Birlanagar, Bansberia, Belgurriah, Triveni, Hugli, Belur, etc.
3. Bangalore-Chennai Industrial Region
This region witnessed most rapid industrial growth in post-Independence period. Till 1960, industries were confined to Bangalore, Salem and Madurai districts but now they have spread over all the districts of Tamil Nadu except Viluppuram. Since, this region is away from the coalfields; its development is dependent on the Pykara hydroelectric plant, which was built in 1932. Cotton textile industry was the first to take roots due to the presence of cotton growing areas. Along with cotton mills, loom industry spread very rapidly. Several heavy engineering industries converged at Bangalore. Aircraft (HAL), machine tools, telephone (HTL) and Bharat Electronics are industrial landmarks of this region. Important industries are textiles, rail wagons, diesel engines, radio, light engineering goods, rubber goods, medicines, aluminium, sugar, cement, glass, paper, chemicals, film, cigarette, match box, leather goods, etc. Petroleum refinery at Chennai, iron and steel plant at Salem and fertiliser plants are recent developments.
4. Gujarat Industrial Region
The nucleus of this region lies between Ahmedabad and Vadodara but this region extends upto Valsad and Surat in the south and to Jamnagar in the west. Development of this region is also associated with the location of the cotton textile industry since 1860s. This region became an important textile region with the decline of the cotton textile industry at Mumbai. Located in cotton growing area, this region has double advantage of the proximity of raw materials as well as of market. The discovery of oil fields led to the establishment of petrochemical industries around Ankleshwar, Vadodara and Jamnagar. The port at Kandla helped in the rapid growth of this region. Petroleum refinery at Koyali provided raw materials to a host of petrochemical industries. The industrial structure is now diversified. Besides, textiles (cotton, silk and synthetic fabrics) and petrochemical industries, other industries are heavy and basic chemicals, motor, tractor, diesel engines, textile machinery, engineering, pharmaceuticals, dyes, pesticides, sugar, dairy products and food processing. Recently, largest petroleum refinery has been set up at Jamnagar. Important industrial centres of this region are Ahmedabad, Vadodara, Bharuch, Koyali, Anand, Khera, Surendranagar, Rajkot, Surat, Valsad and Jamnagar.
5. Chotanagpur Region
This region extends over Jharkhand, northern Orissa and western West Bengal and is known for the heavy metallurgical industries. This region owes its development to the discovery of coal in the Damodar Valley and metallic and non-metallic minerals in Jharkhand and northern Orissa. Proximity of coal, iron ore and other minerals facilitated the location of heavy industries in this region. Six large integrated iron and steel plants at Jamshedpur, Burnpur- Kulti, Durgapur, Bokaro and Rourkela are located within this region. To meet the power requirement, thermal and hydroelectric plants have been constructed in the Damodar Valley. Densely populated surrounding regions provide cheap labour and Hugli region provides vast market for its industries. Heavy engineering, machine tools, fertilisers, cement, paper, locomotives and heavy electrical are some of the important industries in this region. Important centres are Ranchi, Dhanbad, Chaibasa, Sindri, Hazaribag, Jamshedpur, Bokaro, Rourkela, Durgapur, Asansol and Dalmianagar.
6. Vishakhapatnam-Guntur Region
This industrial region extends from Vishakhapatnam district to Kurnool and Prakasam districts in the south. Industrial development of this region hinges upon Vishakhapatnam and Machilipatnam ports and developed agriculture and rich reserves of minerals in their hinterlands. Coalfields of the Godavari basin provide energy. Ship building industry was started at Vishakhapatnam in 1941. Petroleum refinery based on imported petroleum facilitated the growth of several petrochemical industries. Sugar, textile, jute, paper, fertiliser, cement, aluminium and light engineering are principal industries of this region. Important industrial centres are Vishakhapatnam, Vijayawada, Vijaynagar, Rajahmundry, Guntur, Eluru and Kurnool
7. Gurgaon-Delhi-Meerut Region
This region is located far away from the mineral and power resources, and therefore, the industries are light and market-oriented. Electronics, light engineering and electrical goods are major industries of this region. Besides, there are cotton, woollen and synthetic fabrics, hosiery, sugar, cement, machine tools, tractor, cycle, agricultural implements, chemical and vanaspati industries which have developed on large scale. Software industry is a recent addition. To the south lies the Agra-Mathura industrial area which specialises in glass and leather goods. Mathura with an oil refinery is a petrochemical complex. Among industrial centres, mention is made of Gurgaon, Delhi, Shahdara, Faridabad, Meerut, Modinagar, Ghaziabad, Ambala, Agra and Mathura.
8. Kollam-Tiruvanantapuram Region
This industrial region is spread over Tiruvanantapuram, Kollam, Alwaye, Ernakulam and Alappuzha districts. Plantation agriculture and hydropower provide industrial base to this region. Located far away from the mineral belt of the country, agricultural products processing and market oriented light industries predominate the region. Among them, cotton textile, sugar, rubber, matchbox, glass, chemical fertiliser and fish-based industries are important. Food processing, paper, coconut coir products, aluminium and cement industries are also significant. Important industrial centres are Kollam, Tiruvanantapuram, Alluva, Kocchi, Alappuzha, and Punalur.
Minor Industrial Regions:
1. Ambala-Amritsar in Haryana-Punjab.
2. Saharanpur-Muzaffamagar-Bijnaur in Uttar Pradesh.
3. Indore-Dewas-Ujjain in Madhya Pradesh.
4. Jaipur-Ajmer in Rajasthan.
5. Kolhapur-South Kannada in Maharashtra-Karnataka.
6. Northern Malabar in Kerala.
7. Middle Malabar in Kerala.
8. Adilabad-Nizamabad in Andhra Pradesh.
9. Allahabad-Varanasi-Mirzapur in Uttar Pradesh.
10. Bhojpur-Munger in Bihar.
11. Durg-Raipur in Chhattisgarh.
12. Bilaspur-Korba in Chhattisgarh.
13. Brahmaputra Valley in Assam.
Industrial Districts:
1. Kanpur, 2 Hyderabad, 3. Agra, 4. Nagpur, 5 Gwalior, 6. Bhopal, 7. Lucknow, 8. Jalpaiguri, 9. Cuttack, 10. Gorakhpur, 11. Aligarh, 12. Kota, 13. Pumia, 14. Jabalpur, 15. Bareilly.
Indian Industries
Industry accounts for 26% of GDP and employs 22% of the total workforce. According to the World Bank, India’s industrial manufacturing GDP output in 2015 was 6th largest in the world on current US dollar basis ($559 billion), and 9th largest on inflation-adjusted constant 2005 US dollar basis ($197.1 billion). The industrial sector underwent significant changes due to the 1991 economic reforms, which removed import restrictions, brought in foreign competition, led to the privatisation of certain government-owned public-sector industries, liberalised the foreign direct investment (FDI) regime, improved infrastructure and led to an expansion in the production of fast-moving consumer goods. Post-liberalisation, the Indian private sector was faced with increasing domestic and foreign competition, including the threat of cheaper Chinese imports. It has since handled the change by squeezing costs, revamping management, and relying on cheap labour and new technology.
Major Industries in India
TEXTILE INDUSTRY
The archaeological surveys and studies have found that the people of Harrapan civilization knew weaving and the spinning of cotton four thousand years ago. Reference to weaving and spinning materials is found in the Vedic Literature.
The textile industry in India traditionally, after agriculture, is the only industry that has generated huge employment for both skilled and unskilled labour in textiles. The textile industry continues to be the second-largest employment generating sector in India. It offers direct employment to over 35 million in the country. The share of textiles in total exports was 11.04% during April–July 2010, as per the Ministry of Textiles. During 2009–2010, the Indian textile industry was pegged at US$55 billion, 64% of which services domestic demand. In 2010, there were 2,500 textile weaving factories and 4,135 textile finishing factories in all of India.
India is first in global jute production and shares 63% of the global textile and garment market. India is second in global textile manufacturing and also second in silk and cotton production. 100% FDI is allowed via automatic route in textile sector.
COTTON TEXTILE INDUSTRY
Growth and Development
India held world monopoly in the manufacturing of cotton textiles for about 3,000 years from about B.C. 1500 to A.D. 1500. In the middle ages, Indian cotton textile products were in great demand in the Eastern and European markets.
The first modem cotton textile mill was set up in 1818 at Fort Glaster near Kolkata. But this mill could not survive and had to be closed down. The first successful modem cotton textile mill was established in Mumbai in 1854 by a local Parsi entrepreneur C.N. Dewar. Shahpur mill in 1861 and Calico mill in 1863 at Ahmedabad were other landmarks in the development of Indian cotton textile industry.
The real expansion of cotton textile industry took place in 1870’s. By 1875-76 the number of mills rose to 47 of which over 60 per cent were located in Mumbai city alone. The industry continued to progress till the outbreak of the First World War in 1914. The total number of mills reached 271 providing employment to about 2.6 lakh persons.
The First World War, the Swadeshi Movement and the grant of fiscal protection favoured the growth of this industry at a rapid pace. Demand for cloth during the Second World War led to further progress of the industry. Consequently, the number of mills increased from 334 in 1926 to 389 in 1939 and 417 in 1945. Production of cloth also increased from 4,012 million yards in 1939-40 to 4,726 million yards in 1945-46.
The industry suffered a serious setback in 1947 when most of the long staple cotton growing areas went to Pakistan as a result of partition. However, most of the cotton mills remained in India. Under such circumstances, India faced a severe crisis of obtaining raw cotton.
The country had, therefore, to resort to large-scale imports of long staple cotton which was an extremely difficult task in view of the limited foreign exchange reserves. The only solution to this problem was to increase hectare-age and production of long staple cotton within the country. This goal was achieved to a great extent in the post partition era.
Present Position:
At present, cotton textile industry is largest organised modem industry of India. There has been a phenomenal growth of this industry during the last four decades. About 16 per cent of the industrial capital and over 20 per cent of the industrial labour of the country is engaged in this industry. The total employment in this industry is well over 15 million workers.
There are at present 1,719 textile mills in the country, out of which 188 mills are in public sector, 147 in cooperative sector and 1,384 in private sector. About three-fourths were spinning mills and the remaining one-fourth composite mills. Apart from the mill sector, there are several thousand small factories comprising 5 to 10 looms.
Some of them have just one loom. These are based on conventional handloom in the form of cottage industry and comprise decentralised sector of this industry. Table 27.4 shows that the constitution of decentralised sector is much more than the organised sector.
It has increased rapidly from a mere 19.31 per cent in 1950-51 to 58.96 per cent in 1980-81 and made a sudden jump to 87.95 per cent in 1990-91. It gradually improved during the first half of 1990s and stood at 94.63 per cent in 2003-04.
Production:
Cotton cloth is produced in three different sectors viz.,
1. Mills,
2. Power-looms and
3. Handlooms.
1. Mills:
The mill sector played a dominant role in cotton textile industry at the initial stage. But its importance was reduced drastically with the growth of powerlooms and handloom. The share of mill sector in cotton cloth production came down from 80.69 per cent in 1950-51 to only 5.37 per cent in 2003-04.
2. Powerlooms:
The decentralised powerloom sector plays a pivotal role in meeting the clothing needs of the country. The production of cloth as well as generation of employment has been rapidly increasing in powerloom sector. This sector not only contributes significantly to the cloth production in the country but also provides employment to millions of people.
The powerloom industry produces a wide variety of cloth with intricate designs. The powerloom sector accounts for about 63 per cent of the total cloth production in the country and contributes significantly to the export earnings.The production of cloth as well as employment has been increasing in the powerloom sector. During 2002-03, the production of cloth in the decentralised powerloom sector was 18,281 million sq. metres while the employment generation was 4.23 million. The corresponding figures estimates for 2003- 04 were 17,071 million sq metre and 4.18 million respectively.
3. Handlooms:
The handloom sector provides employment to over 65 lakh persons engaged in weaving and allied activities. The production of handloom fabrics registered more than fifteen fold increase from 500 million sq metres in 1950-51 to 7,585 million sq metres in 2001-02. This sector constitutes nearly 14 per cent of the total cloth produced in the country and also contributes substantially to the export earnings.
The production of spun yam and cotton cloth has increased considerably during the 53 years from 1950-51 to 2003-04. The production of spun yarn registered more than fourfold increase from 533 million kg in 1950-51 to 2,121 million kg in 2003-04.
Although the total production of cotton cloth increased considerably, the share of mill sector has been drastically reduced. This is an indication of our efforts to decentralise the industry and create greater employment opportunities.
There are about 40 lakh handlooms and about 5 lakh power looms in the decentralised sector. Although they are widely distributed throughout the country, states of Tamil Nadu, Uttar Pradesh, Assam and Manipur account for nearly 50 per cent of the production capacity.
The rest are scattered in Nagaland, West Bengal, Madhya Pradesh, Andhra Pradesh. Maharashtra, Kerala, Rajasthan, Haryana and Jammu and Kashmir. Table 27.5 shows that power looms contribute an overwhelmingly large percentage of production of fabrics.
Production of Cotton Cloth (Mill Cloth) in India, 2002-03:
|
State/Ut |
Production |
Percentage |
|
1. Mah |
3,82,257 |
39.38 |
|
2. Gujarat |
3,21,775 |
33.14 |
|
3. TN |
64544 |
6.69 |
|
4. Punjab |
55,784 |
5.75 |
|
5. MP |
47305 |
4.87 |
|
6. UP |
32386 |
3.34 |
|
7. Raj |
28384 |
2.92 |
|
8. Pondi |
24357 |
2.51 |
|
9. Kar |
7,222 |
0.74 |
|
10. Kerala |
6342 |
0.66 |
|
Total |
9,70,756 |
100 |
Mill Production of Cotton Yarn in India, 2002-03:
|
State/UT |
Production in |
% of |
|
1. TN |
968 |
44.46 |
|
2. Mah |
235 |
10.79 |
|
3. Punjab |
203 |
9.32 |
|
4. Guj |
176 |
8.08 |
|
5. MP |
98 |
4.51 |
|
6. Har |
98 |
4.51 |
Mill Production of Cotton Yarn in India, 2002-03:
|
State/UT |
Production in |
% of all |
|
7. AnP |
82 |
3.77 |
|
8. Raj |
78 |
3.58 |
|
9. Kar |
66 |
3.03 |
|
10. UP |
46 |
2.12 |
|
11. HP |
43 |
1.97 |
|
Others |
84 |
3.86 |
|
Total |
2,177 |
100.00 |
Locational Factors:
Several factors, like availability of raw cotton, market, transport, etc. play a key role in the localisation of cotton textile industry. The significance of raw cotton is evident from the fact that 80 per cent of the industry is coterminous with the cotton growing tracts of the country.
Some of the important centres such as Ahmedabad, Solapur, Nagpur, Coimbatore and Indore are located in the areas of large scale cotton cultivation.
Mumbai is also not far away from the cotton producing areas of Maharashtra and Gujarat which have contributed a good deal in the localisation and growth of cotton textile industry here. It is equally important to note that cotton is a pure raw material, in the sense that it does not lose much of its weight in the process of manufacturing and the slight loss in weight is more than compensated by the use of sizing materials.
There is not much of difference between the cost of transporting raw cotton and finished cloth. Both can be transported with equal ease and without adding much to the total cost of production. Hence, this industry normally tends to be located at such centres which have favourable transport facilities with respect to market. In other words, it is primarily a market oriented industry.
With tropical and sub-tropical climate, all parts of India provide vast market potential for cotton textile industry. West Bengal, Bihar, Uttar Pradesh, Kerala and Orissa do not grow cotton and still have large number of big centres where cotton textile industry has flourished well.
Thus although in earlier stages of industrialisation, cotton textile manufacturing was concentrated in Mumbai, it has witnessed great spatial spread and now covers almost the entire country. Since, it was a traditional cottage industry, cheap and skilled labour was readily available. The most notable feature of the distribution of the industry is that even within a state, the industry is localised within particular areas and regions, almost to the complete exclusion of others.
Dispersal of industry from the old nuclei started after 1921 with railway lines penetrating into the peninsular region. New centres like Coimbatore, Madurai, Bangalore, Nagpur, Indore, Solapur and Vadodara were favourably located in respect to raw material, market and labour than places of original locations. This industry also reached some places with some additional advantages, such as nearness to coal (Nagpur), financial facilities (Kanpur) and wide market with port facilities (Kolkata).
Dispersal of cotton textile industry was further boosted with the development of hydroelectricity. The growth of this industry in Coimbatore, Madurai and Tirunelveli is largely due to the availability of hydroelectricity from Pykara dam. The industry also tended to shift from areas of high labour cost to those with low labour cost. The labour cost factor played a crucial role in establishing this industry at Madurai, Turunelveli, and Coimbatore.
Distribution:
Although cotton textile mills are located in over 80 towns and cities of India, yet its larger concentration is found in Maharashtra, Gujarat, West Bengal and Uttar Pradesh.
Maharashtra
Maharashtra excels all other states in the development of cotton textile industry. It produces 39.38 per cent mill cloth and 10.79 per cent yarn of India. About three lakh workers are engaged in this industry in Maharashtra. Mumbai is the largest centre in India having 63 mills out of Maharashtra’s total of 122 mills. Mumbai is rightly called the Cottonopolis of India.
Following are the main reasons of phenomenal growth of cotton textile industry in and around Mumbai.
(i) Mumbai enjoys humid climate which is helpful for this industry because thread does not break so frequently.
(ii) Mumbai is a very important port which helps in import of machinery and long staple cotton and export of cloth.
(iii) Cheap hydro-electricity is readily available from the nearby areas.le industry in Maharashtra.
(iv) The black-cotton soil in the hinterland of Mumbai provides cotton as the basic raw material.
(v) Cheap labour can be drawn from the surrounding areas.
(vi) There is ready market for Mumbai products both in India and abroad.
(vii) Mumbai is well-connected by a network of roads and railways which help in easy transportation of raw material and finished goods.
(viii) Facilities for washing and dyeing also exist here.
(ix) There is no dearth of capital inputs.
(x) Mumbai has the advantage of an early start.
Apart from Mumbai, Solapur, Pune, Kolhapur, Satara, Wardha, Nagpur, Aurangabad, Amravati, Akola, Sangli, Chaligaon, Miraz, Mander, Jalgaon, etc. are other centres of cotton textile industry in Maharashtra.
Gujarat:
Gujarat is the second largest producer of cotton textiles. This state accounts for over 33 per cent of the mill cloth and over 8 percent of the yam production of the country. Ahmedabad is the largest centre where 73 out of 118 mills of Gujarat are located. Ahmedabad is the second largest centre of cotton textile industry after Mumbai. Following facilities are available to Ahmedabad:
(i) Ahmedabad lies near the main cotton belt of India and there is no problem of obtaining raw cotton.
(ii) Climate is humid and is suited to this industry.
(iii) Cheap power is readily available.
(iv) Cheap and skilled labour is drawn from the nearby areas.
(v) Ahmedabad is served by a network of railways and roadways.
(vi) Land at Ahmedabad is much cheaper as compared to that in Mumbai.
(vii) Most of Ahmedabad mills produce cheap cloth which finds a ready market among the poor masses of India.
The other important centres of Gujarat are Vadodara, Bharach, Surat, Rajkot, Porbandar, Maurvi, Bhavnagar, Viramgam, Sidhpur, Kelot, Kadi, etc.
Madhya Pradesh:
Cotton is locally grown. Coal provides necessary energy. Abundant cheap labour is available due to backward economy of the masses. Gwalior, Ujjain, Indore, Dewas, Ratlam, Jabalpur, Bhopal, etc. are important centres.
Tamil Nadu:
Among the southern states, Tamil Nadu is an important cotton textile producer. Although Tamil Nadu produces only about 6 per cent of the mill cloth of India, the state excels all other states in the production of yam and accounts for over 44% of the total yam production of the country.
Coimbatore is the most important centre having 200 mills out of Tamil Nadu’s 439 mills and is known as Manchester of South India. But Tamil Nadu’s mills are of smaller size and give comparatively less production. Other important centres are Chennai (10 mills), Madurai, Tirunelveli, Tirucchchirappalli, Salem, Perambur, Tuticorin, etc.
West Bengal:
Kolkata is the most important centre of West Bengal. It enjoys facilities of a port, humid climate, coal from Raniganj, local labour due to high density of population and those of dyeing and washing. But Kolkata suffers from the disadvantage of being away from the main cotton- producing areas of India. The other important centres are Haora, Murshidabad, Hugli, Sirampur, Shiampur and Panihar.
Uttar Pradesh:
Most of cotton textile industry has developed in the western part of Uttar Pradesh. Kanpur is the largest centre and is known as Manchester of Uttar Pradesh. This city has 10 out of 52 cotton textile mills of the state. Other important centres are Moradabad, Varanasi, Agra, Bareilly, Aligarh, Modinagar, Saharanpur, Rampur, Etawah, Lucknow, Mirzapur, etc.
Other producers are detailed as below:
Andhra Pradesh:
Hyderabad, Secunderabad, Guntur, East Godavari and Udayagiri.
Kerala:
Thiruvananthapuram, Alleppey, Kollam, Trichur, Alwaye.
Bihar:
Gaya, Patna, Bhagalpur
Rajasthan:
Pali, Beawar, Vijayanagar, Kishangarh, Ganganagar, Bhilwara, Udaipur, Jaipur, Kota, Ajmer.
Punjab:
Amritsar, Ludhiana, Phagwara.
Haryana:
Bhiwani, Hissar, Rohtak.
Karnataka:
Bangalore, Belgaum, Mangalore, Chitradurga, Devangera, Gulbarga, Chennapatnam, Mysore.
Key Markets and Export Destinations
India exported cotton (chapter 52) of worth US$ 9,925.85 Mn in 2013-14.
India has overtaken Italy and Germany, and is now the second largest textile exporter in the world.
India was the third-largest supplier of textiles and clothing to the US in 2013, contributing about 6.01 per cent of its total imports.
China is the biggest importer of raw cotton from India. The other major cotton importing countries from India are Bangladesh, Egypt, Taiwan, Hong Kong among others.
Various reputed foreign retailers and brands such as Carrefour, Gap, H&M, JC Penney, Levi Strauss, Macy’s, Marks & Spencer, Metro Group, Nike, Reebok, Tommy Hilfiger and Wal-Mart import Indian textile products.
Jute Textiles
- This jute mill was set up at Rishra near Calcutta in 1855.
- After independence, this sector made rapid progress as an export-oriented industry.
- Jute Textiles India is the largest producer of raw jute and jute goods and stands at second place as an exporter after Bangladesh. There were about 80 jute mills in India in 2010-11.
Most of these are located in West Bengal, mainly along the Factors responsible for their location in the Hugli basin are: proximity of the jute producing areas, inexpensive water transport, supported by a good network of railways, roadways and waterways to facilitate movement of raw material to the mills, abundant water for processing raw jute, cheap labour from West Bengal and adjoining states of Bihar, Orissa and Uttar Pradesh. Kolkata as a large urban centre provides banking, insurance and port facilities for export of jute goods.
In 2010-11 the jute industry was supporting 3.7 lakh workers directly and another 40 lakhs small and marginal farmers who were engaged in cultivation of jute and mesta. Many more people were ssociated indirectly.
- Nearly 90% of the manufacturing capacity is located in a narrow belt about 100 km long and 3 km wide along river Hooghly.
- Recently slight dispersal of industries have been marked as the use of gunny bag has increased to many folds in sugar and cement industries.
- These industries are producing gunny bags using local fibres like mesta and Bimlipatlan as the nw
- material for production.
- West Bengal accounts for 84.1 per cent of the total jute manufactures of the country
- Andhra Pradesh contributes another 10 percent of the production.
- India ranks number two in the export of jute goods in the world.
Challenges faced by the industry include stiff competition in the international market from synthetic substitutes and from other competitors like Bangladesh, Brazil, Philippines, Egypt and Thailand. However, the internal demand has been on the increase due to the Government policy of mandatory use of jute packaging. To stimulate demand, the products need to be diversified. In 2005, National Jute Policy was formulated with the objective of increasing productivity, improving quality, ensuring good prices to the jute farmers and enhancing the yield per hectare. The main markets are U.S.A., Canada, Russia, United Arab Republic, U.K. and Australia. The growing global concern for environment friendly, biodegradable materials, has once again opened the opportunity for jute products.
Iron and steel industry
The iron and steel industry is one of the most important industries in India. During 2014 through 2016, India was the third largest producer of raw steel[1] and the largest producer of sponge iron in the world. The industry produced 91.46 million tons of total finished steel and 9.7 million tons of raw iron. Most iron and steel in India is produced from iron ore.
There are two types of steel plants – mini steel plants and integrated steel plants.
- Mini steel plants are smaller, have electric furnaces, used steel scrap and sponge iron. They have re-rollers that use steel ingots as well. They produce Carbon steel and alloy Steel of certain specifications. There are around 650 mini steel plants in India.
- Integrated steel plants are large, handle everything in one complex – from putting together raw material to steel making, rolling and shaping. Iron ore, coke, and flux are fed into the blast furnace and heated. The coke reduces the iron oxide in the ore to metallic iron, and the molten mass separates into slag and iron. Some of the iron from the blast furnace is cooled, and marketed as pig iron; the rest flows into basic oxygen furnaces, where it is converted into steel. Iron and steel scrap may be added to both to the blast furnace and to the basic iron furnace. There are about five integrated SAIL plants in India.
- The iron and steel industry in India is organised into three categories: main producers, other major producers, and secondary producers. In 2004-05, the main producers i.e. SAIL, TISCO and RINL had a combined capacity of around 50% of India’s total steel production capacity and production. The other major producers — ESSAR, ISPAT and JVSL — account for around 20% of the total steel production capacity.
Production
The steel industry in India was delicensed and decontrolled in the years 1991 and 1992 respectively. In 2014-15, production for sale of total finished steel (alloy + non-alloy) was 91.46 Million Tonnes, a growth of 4.3% over 2013-14. Production for sale of Pig Iron in 2014-15 was 9.7 million tonnes, a growth of 22% over 2013-14. India is the largest producer of sponge iron in the world with the coal-based route accounting for 90% of total sponge iron production in the country. Data on production for the sale of pig iron, sponge iron and total finished steel (alloy + non-alloy) are given below for last five years.
Production (in million tonnes)
|
Category |
2010-11 |
2011-12 |
2012-13 |
2013-14 |
2014-15 |
|
Pig Iron |
5.68 |
5.371 |
6.870 |
7.950 |
9.694 |
|
Sponge Iron |
25.08 |
19.63 |
14.33 |
18.20 |
20.38 |
|
Total Finished |
68.62 |
75.70 |
81.68 |
87.67 |
91.46 |
Import and export
Imports
Iron and steel are freely importable as per the extant policy. There has been a steady increase in the amount of steel imported into the country to meet demands.
Imports (in Million Tonnes)
|
Category |
2012-13 |
2013-14 |
2014-15 |
||
|
Total Finished Steel |
7.93 |
5.45 |
9.32 |
Exports
Iron and steel are freely exportable. In the years 2010-11, India exported about 3.64 million tonnes of steel; further, in 2011-12 it rose to 4.59 million tonnes. 2012-13 and 2013-14 did not see a sharp rise with exports of 5.37 and 5.98 million tonnes respectively. The exports declined in the year 2014-15, falling to 5.59 million tonnes.
Exports (in Million Tonnes)
|
Category |
2012-13 |
2013-14 |
2014-15 |
||
|
Total Finished Steel |
5.37 |
5.98 |
5.59 |
Major Iron and Steel Plants of India
1. Tata Iron and Steel Company (TISCO):
This is the oldest iron and steel centre of India. It is a private sector enterprise. It was established in 1907 by Jamshedji Tata at Sakchi in Singhbhum district of Jharkhand. Later on, it was renamed as Jamshedpur after Jamshedji. It started producing pig iron in 1911 and steel in 1912.
The plant initially had capacity of producing 1.21 million tonnes of pig iron and 1.1 million tonnes of steel per annum. This capacity has been enhanced to 3.9 million tonnes of pig iron, 2 million tonnes of ingot steel and 3 million tonnes of saleable steel. Currently it produces about 3 million tonnes of saleable steel. Following facilities are available to this centre:
(i) High grade haematite iron ore is available from Noamundi mines of Singhbhum in Jharkhand and Gurumahisani mines of Mayurbhanj in Orissa. These mines are located at a distance of 75-100 km from Jamshedpur.
(ii) Coal is available from Jharia and Raniganj coal mines located 160 to 200 km from Jamshedpur.
(iii) Manganese comes from Joda mines of Kendujhar district in Orissa.
(iv) Dolomite, limestone and fire clay used as flux material are available from Sundargarh district of Orissa.
(v) Kolkata, located at a distance of 250 km, provides port facilities and its industrialised hinderland provides market for the products.
(vi) Sufficient water for cooling purposes is obtained from Subamrekha River. In addition to this, the storage dam on Kharkai River also provides water.
(vii) Jamshedpur is well connected with Kolkata, Mumbai and Chennai by road and rail and enjoys good transport facilities.
(viii) Densely populated regions of Jharkhand, Bihar and Orissa provide cheap labour. Major part of labour is drawn from tribal areas of Chota Nagpur plateau.
The shortage of space in Jamshedpur and some other allied factors persuaded TISCO to locate a second steelworks at Gopalpur in Orissa, about 170 kms south-east of Bhubaneswar. The favourable factors are coastal location, proximity to a rich iron ore belt, availability of sparsely settled land for the project, a nearby source of fresh water in the form of a rivulet, proximity to the trunk rail line and a national highway and the presence of a minor deep water port which could be expanded.
Tata Steel acquired land near Gopalpur to set up a shore based steel plant in 1997 but shelved the project later due to slow pace of development of Gopalpur port and a resistance movement by local people. Consequently the Tata Steel decided to build a six million tonne plant at Duburi.
The infrastructure included development of the Dhamra port and a railway line between Dhamra and Bhadrakh. The project is a part of Tata Steel’s plan to reach 15 million tonne capacity by 2010. This plant will use the latest technology and will be cost competitive with the most efficient steel plants in the world.
2. Indian Iron and Steel Company (IISCO):
Three plants at Kulti, Hirapur and Bumpur in West Bengal were set up in 1864, 1908 and 1937 respectively. These plants have been merged together and are known as Indian Iron and Steel Company (IISCO).
It was brought under government control and management in July 1972. The three plants are linked by Kolkata-Asansol railway line. Hirapur plant produces pig iron which is sent to Kulti for making steel. The rolling mills are located at Bumpur. IISCO enjoys the following advantages:
(i) Iron ore is available from Guna mines in Singhbhum district of Jharkhand located at a distance of 285 km. Some iron ore is also obtained from Mayurbhanj area of Orissa.
(ii) It used to receive coal from Jharia, located at a distance of 137 km but now the power from the Damodar Valley Corporation is extensively used.
(iii) Dolomite and limestone are obtained from Sundargarh district of Orissa which is 327 km away. Limestone is also available from Gangpur and Paraghat areas of Orissa.
(iv) Rail and road links connect it to Kolkata which is just 200 km away.
(v) Cheap labour is readily available from the neighbouring areas.
IISCO has annual capacity of producing 10 lakh tonnes of steel. Currently it produces over 4 lakh tonnes of pig iron, more than 3.5 lakh tonnes of crude steel and around 3.8 lakh tonnes of saleable steel.
3. The Visweswaraya Iron and Steel Ltd:
It was established as Mysore Iron and Steel Company (MISCO) in 1923 by the erstwhile state of Mysore. It is located at Bhadravati on the banks of river Bhadravati in Shimoga district of Karnataka. This plant was brought under state control in 1962 and was renamed as Visveswaraya Iron and Steel Ltd. after the name of great engineer Dr. Visweswaraya. This plant has got a capacity of 1.38 lakh tonnes of steel. There are plans to raise its capacity to two lakh tonnes. This centre enjoys the following advantages.
(i) Bhadravati valley is 13 km wide as a result of which enough land is available.
(ii) High grade haematite iron ore is brought from Kemmangundi mines in Chikmaglur which is just 40 km away.
(iii) At the time of the setting up of the plant in 1923 the charcoal obtained from the forest-wood was used for smelting because coal was not available. Now it uses hydroelectric power obtained from Sharavati Power Project.
(iv) Limestone is available from Bhundiguda just 25 km away.
(v) Shimoga and Chitradurga supply manganese. These areas are just 50 km away.
(vi) Dolomite and chromite are also available within a radius of 45-50 km.
(vii) It lies on the main Bim-Shimoga railway line and makes use of railway facilities.
In order to increase the production of iron and steel, the Government of India established The Hindustan Steel Limited in public sector. Consequently, three plants under the public sector, i.e. Bhilai, Rourkela and Durgapur came into operation during the Second Five Year Plan. Capacity of each plant was fixed at 10 lakh tonnes of steel which was expanded during the Third Five Year Plan and a proposal of setting up a steel plant at Bokaro was also made.
4. Bhilai:
Bhilai iron and steel centre was set up in Durg district of Chhattisgarh in 1957 with the technical and financial support of the then Soviet Union. It started production in 1959. Its initial capacity was 10 lakh tonnes which has been raised to 52 lakh tonnes.
Durg happens to be a backward area and the purpose of setting this plant was to bring prosperity to this area. This plant produced 41.87 lakh tonnes of crude steel, 38.32 lakh tonnes of saleable steel and 2.43 lakh tonnes of pig iron in 1996- 97. It enjoys following geographical advantages:
(i) It procures rich haematite iron ore from Dalli-Rajhara range which is 80 km south of Bhilai.
(ii) Coal is obtained from Korba and Kargali fields of Chhattisgarh located at 225 km away. Bokaro and Jharia (720 km) also supply coal.
(iii) Limestone comes from Nandini mines hardly 24 km away.
(iv) Bhandara of Maharashtra and Balaghat of Madhya Pradesh supply manganese.
(v) The Korba Thermal Power station is the main source of power.
(vi) It is connected with Kolkata-Nagpur railway line.
(vii) Dolomite comes from Bilaspur.
(viii) Cheap labour is available from the nearby areas.
5. Rourkela:
Plant of Hindustan Steel Limited at Rourkela is situated in the Sundargarh district of Orissa It was set up with the help of the then West German firm, Krupps and Demang, during t e Second Five Year Plan (West Germany and East Germany have united to form one country now). It became operative in 1959. It produced 12.40 lakh tonnes of crude steel, 11.80 lakh tonnes of saleable steel and 0.54 lakh tonnes of pig iron in 1996-97. This plant has the following facilities for its successful operation:
(i) This plant uses iron ore obtained from Sundargarh and Keonjhar districts. These iron ore sources are located within a distance of 77 km from the site of the plant.
(ii) Coal is obtained from Jharia coalfields and Talcher, located at a distance of 169 km.
(iii) Hydro-electric power is obtained from Hirakud Power Project, located at a distance of 150 km.
(iv) The plant receives manganese from Barajmda, dolomite from Baradwar and limestone from Pumapani. These materials are located within a radius of 222 km in Orissa.
(v) It is located on the main Nagpur-Kolkata railway line and enjoys facilities of railway transport.
(vi) Kolkata provides the port facilities and its hinterland serves as market.
6. Durgapur:
This plant of The Hindustan Steel Ltd. is located at Durgapur in Bardhaman district of West Bengal. It was set up in 1959 with the help of the United Kingdom. The production started in 1962. It has a total capacity of 35 lakh tonnes. It produced 12.45 lakh tonnes of crude steel, 10.93 lakh tonnes of saleable steel and 1.14 lakh tonnes of saleable pig iron in 1996-97.
The Alloy Steel Plant at Durgapur has a capacity to produce 1.6 lakh tonnes of ingots steel which has been expanded to 2. lakh tonnes of crude steel. The following geographical factors favour its location and growth.
(i) Iron ore comes from Bolani mines. Mayurbhanj also supplies iron ore. These areas are located within a radius of 320 km.
(ii) Coal comes from Jharia and Raniganj.
(iii) Limestone is obtained from Birmitrapur in Sundargarh and manganese from Keonjhar district of Orissa.
(iv) Dolomite is supplied by Birmitrapur.
(v) Hydroelectricity is available from Damodar Valley Corporation.
(vi) Plenty of water is available from Durgapur Barrage built across Damodar River.
(vii) The Kolkata-Asansol railway line links it with other parts of the country.
(viii) Cheap labour is readily available from the surrounding areas.
7. Bokaro:
A new public sector company, the Bokaro Steel Ltd. was formed in 1964 to erect a steel plant with the collaboration of the eartwhile Soviet Union at Bokaro near the confluence of the Bokaro and Damodar rivers in Hazaribagh district of Jharkhand. It is the second plant set up with the Soviet help. It started production in 1972. Its initial capacity was 10 lakh tonnes which was raised to 40 lakh tonnes.
There are plans to raise its capacity to 100 lakh tonnes making it the largest iron and steel making centre in India. It produced 36.44 lakh tonnes of crude steel, 30.46 lakh tonnes of saleable steel and 2.6 lakh tonnes of pig iron in 1996-97. This achievement has been made possible due to following few geographical factors:
(i) It receives iron ore from Kiriburu mine in Orissa., (ii) Coal is obtained from Jharia coalfields located at a distance of 65 km., (iii) Limestone comes from Palamu district of Jharkhand., (iv) Hydroelectricity is obtained from Damodar Valley Corporation. (v) Kolkata is just 300 km from here and provides port facilities.
Three more steel plants were planned during the Fourth Five-Year Plan in order to meet the growing requirement of steel. These plants are located at Salem in Tamil Nadu, Vishakhapatnam in Andhra Pradesh and Vijayanagar in Karnataka.
8. The Salem Steel Plant:
The plant has been set up at Salem in the Salem district of Tamil Nadu. The plant has the advantage of rich iron ore and limestone, which is readily available in the adjoining areas. It also enjoys the facilities of cheap power, charcoal and vast market. The iron ore available here has low sulphur and phosphorus content and is suitable for producing special grade iron and steel.
The plant started commercial production in 1982. Its capacity was 32 thousand tonnes of stainless steel sheets in the beginning. This capacity was doubled in 1991 with the addition of another rolling mill. This capacity was further raised to 80 thousand tonnes of saleable steel in 1995-96.
Today the Salem Steel Plant is a major producer of world class stainless steel and is in a position to export stainless steel to some of the advanced countries such as the USA, Mexico, Australia and some countries of South-East Asia.
In order to cater to the growing demand for coinage of the Indian Government Mints, the management had also set up a blanking facility in 1993 with a capacity of 3,000 tonnes per annum. It also commissioned a hot rolling facility in November, 1995 which has state-of-the-art technology with high level of automation. This plant produced 48 thousand tonnes of saleable steel in 1995-96.
9. Vijayanagar Steel Plant:
This plant has been set up at Tomagal near Hospet in Bellary district of Karnataka. It has the installed capacity of 30 lakh tonnes. The production of mild steel will be its special feature. This plant enjoys the following facilities:
(i) Iron ore is obtained from Hospet region located in close proximity.
(ii) Coal comes from Kanhan valley in Chhattisgarh and Singareni coal fields in Andhra Pradesh.
(iii) Good quality limestone and dolomite is available at a distance of about 200 km.
(iv) Water and power requirements are met by the Tungabhadra hydel project located at a distance of about 36 km from the plant.
Another steel plant at Paradwip is fast coming up.
10. Vishakhapatnam Steel Plant (VSP):
This integrated steel plant has a unique location on the sea port. In fact, it is the first shore based steel plant in the country. Although the foundation stone of the plant was laid in 1972, the construction work could not start in the real sense till February 1982 when Rashtriya Ispat Nigam Limited was incorporated as a public sector company to implement the construction of the plant.
The project has been completed in two stages: the first stage was completed by March 1992 and the second and final stage by July 1992. This is the most sophisticated modem integrated steel plant in the country. Though the production commenced in 1991-92, 1993-94 was the first full year of integrated operation.
In the year 1997-98, this plant produced 32.14 lakh tonnes of hot metal, 25.4 lakh tonnes of liquid steel, 22.5 lakh tonnes of saleable steel and 7.7 lakh tonnes of pig iron. It is a major export oriented steel plant and takes full advantage of its coastal location. In 1995-96, it exported 10.23 lakh tonnes of iron and steel worth Rs.702 crore, mainly to China and south-east Asian countries.
The plant has the following advantages:
(i) The coastal location facilitates import of coal and export of iron and steel.
(ii) It is well connected to coal fields of Damodar valley in Jharkhand. Metallurgical coal is imported from Australia which meets about 70 per cent power requirements.
(iii) The plant has a bright future with respect to its energy requirements because there are plans to replace coal imported from Australia by natural gas from the Krishna-Godavari basin.
(iv) High quality rich iron ore deposits are available in the Bailadila area of Chhattisgarh.
(v) Most of the requirements of limestone, dolomite and manganese are met by supplies from Chhattisgarh; Madhya Pradesh and Orissa.
11. Daitari Steel Plant:
A decision to set another steel plant at Daitari near Paradwip in Orissa has been taken. Initially, the plant was scheduled to be built by joint venture of British and South Korean companies but its responsibility has been given to the Tata group. The plant is expected to have capacity of producing 2.6 million tonnes of steel per annum.
12. Tata Steel Kalinganagar:
Tata Steel will set up a six million plant at Kalinganagar in Orissa with an investment of Rs. 15,000 crore. Land for the project has been acquired and detailed project report has been prepared. The first phase of 3 million tonnes capacity will be completed in three and a half years.
Along with this project, Tata Steel is going to build a port at Dharma in Orissa in a joint venture with Larsen & Toubro to handle 3,00,000 tonne ship. A Rs. 1,500 crore investment has been earmarked for the port to facilitate import of coal and export of finished goods.
13. Dolvi Steel Plant:
A new steel plant is fast coming up at Dolvi in Ratnagiri district in Maharashtra. Being set up by the Ispat Industries Ltd., the plant will use new technology in steel making. The 3 million tonnes annual capacity hot rolled coil plant will be one of the most modern plants in the world. It will require less space, less energy, high labour productivity and will involve less cost of production. Producing thin strips will be a special quality of this plant.
Posco Steel, Paradwip:
Pohang Steel Company (Posco) of Korea has entered into a Memorandum of Understand (MoU) with Orissa Government for setting up a steel plant at Paradwip with a total investment of Rs. 51,000 crore.
The project with a capacity of 12 million tonnes per annum will be completed by 2016. It is billed as the biggest foreign direct investment (FDI) in Indian history. A huge quantity of 600 million tonnes of iron ore will be made available for manufacturing iron and steel.
Aluminium Smelting
Aluminium smelting is the second most important metallurgical industry in India. It is light, resistant to corrosion, a good conductor of heat, mallable and becomes strong when it is mixed with other metals. It is used to manufacture aircraft, utensils and wires. It has gained popularity as a substitute of steel, copper, zinc and lead in a number of industries.
Process of Manufacturing in Aluminium Industry
- Bauxite: It is use as raw material
- Alumina: Bauxite crushed and alumina dissolved out > Bulk ore shipped to site of smelter> Calcinated petroleum coke from a refinery > Aluminium refinery: Pitch from a colliery
- Cryolite: A molten metal acts as an electrolyte > Aluminium Smelter> Passage of electricity.
Major Aluminium Producing Plant in India
- Aluminium smelting is the second important metallurgical industry of India, next only to Iron and Steel industry. Manufacturing of aluminium metal commenced in 1886 and fabrication of utensils from imported metal started in 1929. Indian Aluminium company started its production in 1938.
- The Indian Aluminium company Ltd. (INOAL) started fabrication of sheets from imported alumina in 1943 and production of alumina from indigenous bauxite in 1948.
- INDAL have 3 unit viz, at Muri (Jharkhand), at Alupuram (Kerala) and at Belur (Karnataka).
- Aluminium is extracted from bauxite at Muri in Jharkhand.
- The reduction plant of alumina is located at Alupuram in Kerala and the fabrication plant at Belur manufactures aluminium sheets, rods, aluminium paste, electric conductors, domestic utensils etc.
Aluminum extrusion plants in India
|
Rank |
Location |
Annual |
|
1 |
Korba |
900,000 |
|
2 |
Jharsuguda |
500,000 |
|
3 |
Angul |
475,000 |
|
4 |
Belgaum, |
390,000 |
|
5 |
Bargawan |
360,000 |
|
6 |
Lapanga |
360,000 |
|
7 |
Renukoot |
345,000 |
|
8 |
Hirakud |
213,000 |
Alumina refineries in India
|
Location |
Name of Company Ownership |
Plant Capacity Per year (KT/year) |
|
Damanjodi, Orissa |
United Nations 2000, NALCO |
1,600 |
|
Belgaum, Karnataka |
INDAL, Hindalco, (United Nations 2000) |
390 |
|
Korba, Alumina, Chhattisgarh |
Sterlite Industries, BALCO, (United Nations 2000) |
205 |
|
Gujarat Alumina Project |
||
|
Vedanta Alumina, Lanjigarh, Orissa |
Vedanta Resources |
1000 |
|
Muri Alumina |
Hindalco, INDAL, (United Nations 2000) |
120 |
|
Mettur Alumina, Tamil Nadu |
Sterlite Industries, MALCO, (United Nations 2000) |
100 |
|
Utkal Alumina Project, Kashipur, Orissa |
Hindalco |
0 |
|
Renukoot Alumina, Uttar Pradesh |
(United Nations 2000), Hindalco |
700 |
- The Indian Aluminium Company Ltd. (INDAL), Hirakud: It started production in 1938 as a private company and was converted into a public company in 1944. It is an integrated plant having three units at five different places for the pro-duction of alumina and aluminium sheets. The plants for the extraction of alumina from bauxite are located at Muri (Jharkhand), near the bauxite mines. Its three smelting units are located at Alupuram (Alwaye in Kerala), Hirakud (Orissa), and Belgaum (Karnataka).
- The Aluminium Corporation of India, Jaykaynagar (near Asansol): It started production in 1942. The plant gets bauxite from Ranchi (Jharkhand) and Unchera (M.P.). It has its own coal-mine, a thermal power plant and an alumina plant, a reduction plant, a sheet rolling plant and a utensils producing plant.
- The Hindustan Aluminium Corporation Ltd. (HINDALCO), Renukoot: It was set up at Renukoot, about 160 km south of Mirzapur, in 1958. It obtains bauxite from Lohardaga (Jharkhand and Amarkantak region of Madhya Pradesh), and power from the Rihand Dam.
- The Madras Aluminium Company Ltd. (MALCO), Mettur: It was set up at Mettur near Salem in 1965. It obtains bauxite from the Shevaroy Hills and electricity from the Mettur Hydel Project.
- The Bharat Aluminium Company Ltd. (BALCO), Korba: This is a public sector company which set up its plant at Korba (Bilaspur District, Chhattisgarh) in 1965. It obtains bauxite from the Amarkantak (Shandol District of Madhya Pradesh) and electricity from the Korba Thermal Power Plant.
- The National Aluminium Company Ltd. (NALCO), Koraput: It is the largest aluminium plant of the country, located at Koraput. It obtains bauxite from the bauxite mines at Panchpatmali (District Koraput). It has an installed capacity of 1.6 million tonnes of ingots per year. There is an alumina refinery at Damanjodi (District Koraput) and alumina smelter at Angul. It obtains hydro-electricity from the Angul Power Plant and the port facilities from the Vishakhapatnam for export of alumina and import of caustic soda. The Central Government has disinvested about 45 per cent of NALCO’s shares.
Engineering Industries
- Manufacturing of heavy machinery made a beginning in 1958 when Heavy Engineering Corporation Ltd. was set up at Ranchi (Jharkhand).
- These industries contribute about 10% of the total exports of the country
- Drills for drilling holes in rocky areas are manufactured at Naroda (Ahmedabad).
- Kirloskar Brothers Ltd is the pioneer company in the manufacturing of machine tools.
- HMT is the largest manufacture of machine tools in the country.
- HMT’s plants: Bengaluru, Pinjore, Kalamassery (Kerala), Hyderabad, Sri Nagar and Ajmer
- Locomotives: Chittaranjan Locomotive Works, Diesel Locomotive Works (Varanasi), Tata Engineering and Locomotive Works (Jamshedpur) in 1 964.
- BHEL, Bhopal has been developed to manufacture electric locomotive for the Indian railways.
- Wheel and Axle Plant was set up at Bengaluru in 1984.
- The Integral Coach Factory at Perampur near Chennai was set up in 1955 with Swiss collaboration.
- Rail Coach Factory at Kapurthala (Punjab) was set up in 1988.
- Bharat Movers Limited at Bengaluru also produces railways coaches.
- Most of wagons are produced in private sector. About 60% of wagons are produced in West Bengal
Automobile Industry
Automobiles provide vehicle for quick transport of good services and passengers. Trucks, buses, cars, motor cycles, scooters, three-wheelers and multi-utility vehicles are manufactured in India at various centres. After the liberalisation, the coming in of new and contemporary models stimulated the demand for vehicles in the market, which led to the healthy growth of the industry including passenger cars, two and threewheelers. This industry had experienced a quantum jump in less than 15 years. Foreign Direct Investment brought in new technology and aligned the industry with global developments. At present, there are 15 manufacturers of passenger cars and multiutility vehicles, 9 of commercial vehicles, 14 of the two and three-wheelers. The industry is located around Delhi, Gurgaon, Mumbai, Pune, Chennai, Kolkata, Lucknow, Indore, Hyderabad, Jamshedpur and Bengaluru.
Top 10 export destinations
|
R |
Country |
Value (US$) |
Share |
|
1 |
United States |
1.2 billion |
8.4% |
|
2 |
Mexico |
$1 billion |
6.9% |
|
3 |
South Africa |
$888.8 million |
6.1% |
|
4 |
United Kingdom |
$637.4 million |
4.4% |
|
5 |
Sri Lanka |
$596.9 million |
4.1% |
|
6 |
Bangladesh |
$592.1 million |
4.1% |
|
7 |
Turkey |
$580.4 million |
4% |
|
8 |
Nigeria |
$546.8 million |
3.8% |
|
9 |
UAE |
$433.6 million |
3% |
|
10 |
Colombia |
$428.9 million |
3% |
India exported $14.5 billion worth of automobiles in 2014. The 10 countries below imported 47.8% of that total.
Cement Industry
- Cement Industry is mainly based on non-metallic mineral. Its major raw materials are limestone and coal.
- India is one of the largest cement producers in the world after China. First cement plant was set up in Porbandar, Gujarat in 1904 whereas the production of cement was started in 1904 in Madras (Now Chennai).
- The cement industry comprises of 156 large cement plants with an installed capacity of 233.94 million tonnes and more than 350 operating mini cement plants with an estimated capacity of 11.10 million tonnes per annum, make a total installed capacity of 245.04 million tonnes as on 31-12-2009. There are a few large cement plants that are owned by the Central and the State Governments.
- Per capita consumption in India continues to be low at 143 kg, as compared to other countries such as China (1,014 kg) and Japan (524 kg).
Geographical Distribution of Cement Industry in India
|
sn |
City |
State |
sn |
City |
State |
|
|
1 |
Katni |
MP |
12 |
Hopur |
Raj |
|
|
2 |
Jamul |
MP |
13 |
Chittorgarh |
Raj |
|
|
3 |
Satna |
MP |
14 |
Udaipur |
Raj |
|
|
4 |
Durg |
MP |
15 |
Bhadravati |
Kar |
|
|
5 |
Maihar |
MP |
16 |
Porbandar |
Gujarat |
|
|
6 |
Neemach |
MP |
17 |
Sindri |
Jhar |
|
|
7 |
Vijayawada |
AP |
18 |
Churk |
UP |
|
|
8 |
Karimnagar |
AP |
19 |
Dalla |
UP |
|
|
9 |
Cementnagar |
AP |
20 |
Bhupendra |
Punjab |
|
|
10 |
Krishna |
AP |
21 |
Chandrapur |
Mah |
|
|
11 |
Adilabad |
AP |
Durgapur |
Food Processing Industries
- Food processing is the transformation of raw ingredients into food, or of food into other forms (ie. food processing may denote direct manufacturing of food or value addition on existing food). Food processing typically takes harvested crops or butchered animal products and uses these to produce long shelf-life food products.
- Food processing dates back to the prehistoric ages when crude processing incorporated slaughtering, fermenting, sun drying, preserving with salt etc. Modern food processing adopts latest technologies and practices.
- India ranks 1st in the production of – milk, ginger, banana, guava, papaya, mango etc. It ranks 2nd in the production of rice, wheat, potato, sugarcane, cashew nut, tea etc. It is among the top 5 countries in the production of coffee, tobacco, spices, seeds etc. With such a huge raw material base, we can easily become the leading supplier of food items in the world.
- India has more than 35000 registered units. But majorities of the food processing factories are concentrated in the coastal states ( one reason being, accessibility to marine food processing)
- Major coastal states includes: Andhra, Maharashtra, Karnataka, Kerala, Gujarat, Punjab and WB. Non-coastal states include UP, Punjab etc.
Revolutions related to Food Production
- Pink Revolution – Meat and Poultry Production.
- Red Revolution – Meat & Tomato Production.
- Round Revolution – Potato Revolution.
- Silver Fiber Revolution – Cotton Revolution.
- Silver Revolution – Egg/Poultry Production.
- White Revolution – Milk/Dairy production (Operation Flood).
- Yellow Revolution – Oil Seeds production.
- Evergreen Revolution – Overall development of Agriculture.
- Blue Revolution – Fish Production.
- Brown Revolution – Leather /Cocoa production.
- Golden Fibre Revolution – Jute Production.
- Golden Revolution – Overall Horticulture development/Honey Production.
- Green Revolution – Agriculture in general.
Sugar Industry
- India stands second as a world producer of sugar but occupies the first place in the production of gur and khandsari. The raw material used in this industry is bulky, and in haulage its sucrose content reduces. Where should the mills be ideally located? In 2010-11 there were over 662 sugar mills in the country spread over Uttar Pradesh, Bihar, Maharashtra, Karnataka, Tamil Nadu, Andhra Pradesh and Gujarat along with Punjab, Haryana and Madhya Pradesh. Sixty per cent mills are in Uttar Pradesh and Bihar.
- In recent years, there is a tendency for the mills to shift and concentrate in the southern and western states, especially in Maharashtra, This is because the cane produced here has a higher sucrose content. The cooler climate also ensures a longer crushing season. Moreover, the cooperatives are more successful in these states. Major challenges include the seasonal nature of the industry, old and inefficient methods of production, transport delay in reaching cane to factories and the need to maximise the use of baggase.
Geographical distribution
Uttar Pradesh and Bihar alone account for 70% of the productive capacity and 75% of the total employment of 30 lakh.
- Uttar Pradesh: There are two belts one in western Uttar Pradesh and the other in eastern Uttar Pradesh. The western belt includes Meerut, Saharanpur, Muzaffarnagar, Bijnor and Moradabad, and the eastern belt includes Gorakhpur, Deoria, Basti and Gonda.
- Bihar: This is an extension of the eastern Uttar Pradesh belt, which includes Darbhanga, Saran, Champaran and Muzaffarpur.
The reasons for concentration of sugar industry in Uttar Pradesh and Bihar are:
(i) fertile alluvial soil, rich in lime and potash;
(ii) level topography-suitable for irrigation;
(iii) abundant water for washing and processing;
(iv) sugar industry is relatively independent of coal and electricity, because bagasse is enough to run steam;
(v) densely populated market with excellent transport links;
(vi) availability of cheap labour;
(vii) cultivation is done in compact block, which ensures ready availability of fresh cane to factories.
- In Maharashtra, Nasik, Pune, Satara, Sangli, Kolhapur, Sholapur are the centres well integrated in the cooperative sector in terms of cultivation and sugar factories.
- In Punjab, Centres exist mainly in the eastern side, in Phagwara, Dhuri.
- In Karnataka, Munirabad, Shimoga and Mandya are the main centres.
- In Tamil Nadu, Nalikupuram, Pugulur, Coimbatore and Pandyarajpuram are famous for producing sugar.
- Andhra Pradesh. Nizamabad, Medak, west and east Godavari, Visakhapatnam and Chittoor produce sugar.
- In Odisha Bargarh and Rayagada in Odisha produce sugar.
- In Madhya Pradesh, Sehore is the sugar producing centre.
- Food processing is the transformation of raw ingredients into food, or of food into other forms (ie. food processing may denote direct manufacturing of food or value addition on existing food). Food processing typically takes harvested crops or butchered animal products and uses these to produce long shelf-life food products.
- Food processing dates back to the prehistoric ages when crude processing incorporated slaughtering, fermenting, sun drying, preserving with salt etc. Modern food processing adopts latest technologies and practices.
- India ranks 1st in the production of – milk, ginger, banana, guava, papaya, mango etc. It ranks 2nd in the production of rice, wheat, potato, sugarcane, cashew nut, tea etc. It is among the top 5 countries in the production of coffee, tobacco, spices, seeds etc. With such a huge raw material base, we can easily become the leading supplier of food items in the world.
- India has more than 35000 registered units. But majorities of the food processing factories are concentrated in the coastal states ( one reason being, accessibility to marine food processing)
- Major coastal states includes: Andhra, Maharashtra, Karnataka, Kerala, Gujarat, Punjab and WB. Non-coastal states include UP, Punjab etc.
Chemical Industries
Chemical Industry in India is one of the fastest growing industries under the Indian Economy. At the same time it is also one of the oldest domestic industry of India which started working soon after India’s independence in 1947. From those early years, the Chemical Industry in India continued to contribute to the Economic Growth of Indian Economy. At present, the industry accounts for almost 13% of Indian GDP.
The Chemical Industry in India which generates almost 13% of country’s total export is growing annually at a growth rate anywhere between 10% and 12%. Now we can discuss the growth rates and other important things of Chemical Industry in India sector wise.
The Chemical Industry in India is based on the idea of Diversification. The industry is a multi product and multi-faceted one. Depending on these product categories we can divide the Chemical Industry in India in following sectors:
- Inorganic Chemicals-In this sector the growth rate is near about 9% and the chemicals produced in this sector are mainly used in alkalis, fertilizers, detergents and glass.
- Drugs and Pharmaceuticals– This sector of Indian Chemical Industry holds the 4th place in the world in terms of volume. Export led growth is the characteristics of this sector.
- Plastics and Petrochemicals-This sector of the Indian Chemical Industry is the fastest growing one among all the sectors. Reliance Petrochemical is the company which dominates this sector.
- Pesticides, Fertilizers and other Agro-chemical products– This sector of the Chemical Industry in India account for almost 2.5% of the global market. It possesses an impressive domestic market growth rate of 10%.
- Specialty and Fine Chemicals like Dyes and Paints– This sector is characterized by high level of fragmentation. The sector is involved in production of paints, dyes, inks,polymers and a lot of other chemical products. The sector has a growth rate of near about 12%.
Fertilizer Industry
The fertiliser industry is centered around the production of nitrogenous fertilisers (mainly urea), phosphatic fertilisers and ammonium phosphate (DAP) and complex fertilisers which have a combination of nitrogen (N), phosphate (P), and potash (K). The third, i.e. potash is entirely imported as the country does not have any reserves of commercially usable potash or potassium compounds in any form. India is the third largest producer of nitrogenous fertilisers. There are 57 fertiliser units manufacturing nitrogenous and complex nitrogenous fertilisers, 29 for urea and 9 for producing ammonium sulphate as a byproduct and 68 other small units produce single superphosphate. At present, there are 10 public sector undertakings and one in cooperative sector at Hazira in Gujarat under the Fertiliser Corporation of India. After the Green Revolution the industry expanded to several other parts of the country. Gujarat, Tamil Nadu, Uttar Pradesh, Punjab and Kerala contribute towards half the fertilizer production. Other significant producers are Andhra Pradesh, Odisha, Rajasthan, Bihar, Maharashtra, Assam, West Bengal, Goa, Delhi, Madhya Pradesh and Karnataka.
Information Technology Industry
The electronics industry covers a wide range of products from transistor sets to television, telephones, cellular telecom, pagers, telephone exchange, radars, computers and many other equipments required by the telecommunication industry. Bangalore has emerged as the electronic capital of India. Other important centres for electronic goods are Mumbai, Delhi, Hyderabad, Pune, Chennai, Kolkata, Lucknow and Coimbatore. By 2010-11 (STPI) Software Technology Parks of India have come up across 46 locations at different centres of India. However, the major industry concentration is at Bangalore, Noida, Mumbai, Chennai, Hyderabad and Pune.
Major information technology hubs
- Bangalore. Bangaluru is known as the Silicon Valley of India. …
- Chandigarh. Chandigarh is also one of the growing international IT services and outsourcing exporters
- Hyderabad
- Kolkata
- Pune
- Chennai
Aircraft industry
- The first aircraft industry was set up at Bengaluru in 1940 under the name of Hindustan Aircraft Ltd.
- Later, Hindustan Aircraft Ltd was merged into Aeronautics India Ltd in 1964 to form Hindustan Aeronautics Ltd.
- Different Divisions of HAL and production:
- Nashik division – MIG airframe
- Koraput division – Engine of MIG aircraft
- Hyderabad division – Electronic equipment of MIG.
- Transport aircrafts are manufactured at Kanpur.
- Recently, a factory was set up at Lucknow for producing equipment for aircraft.
- Ship Building Industry.
- Visakhapatnam (Andhra Pradesh) Hindustan Shipyard Ltd.
- Cochin (Kerala) Cochin Shipyard Ltd.
- Mumbai (Maharashtra) The Mazgaom Dock
- Goa Goa Shipyard,
- Kolkata (West Bengal) The Garden Reach workshop
Industrial Corridor
An industrial corridor is a package of infrastructure spending allocated to a specific geographical area, with the intent to stimulate industrial development.
An industrial corridor aims to create an area with a cluster of manufacturing or other industry. Such corridors are often created in areas that have preexisting infrastructure, such as ports, highways and railroads. These modalities are arranged such that an “arterial” modality, such as a highway or railroad, receives “feeder” roads or railways. Concerns when creating corridors include correctly assessing demand and viability, transport options for goods and workers, land values, and economic incentives for companies.
Economic Corridors of India or Industrial Corridors of India include:
- Delhi Mumbai Industrial Corridor Project
- Shendra – Bidkin Industrial Park
- Chennai Bangalore Industrial Corridor
- Mumbai-Bangalore economic corridor
- Amritsar Delhi Kolkata Industrial Corridor
- VANPIC – Vadrevu and Nizampatnam Port Industrial Corridor
- Udhana-Palsana Industrial Corridor
Special economic zones in India
An SEZ is an enclave within a country that is typically duty-free and has different business and commercial laws chiefly to encourage investment and create employment.
Apart from generating employment opportunities and promoting investment, SEZs are created also to better administer these areas, thereby increasing the ease of doing business.
SEZ Background
An SEZ Policy was announced for the very first time in 2000 in order to overcome the obstacles businesses faced.
- There were multiple controls and many clearances to be obtained before starting a venture.
- Infrastructure facilities were shoddy and well below world standards in India.
- The fiscal regime was unstable as well.
- In order to attract huge foreign investments into the country, the government announced the Policy.
- The Parliament passed the Special Economic Zones Act in 2005 after many consultations and deliberations.
- The Act came into force along with the SEZ Rules in 2006.
- However, SEZs were operational in India from 2000 to 2006 (under the Foreign Trade Policy).
- Note:- A precursor to the SEZs, the Export Processing Zones were set up in India well before. The first EPZ came up in Kandla in 1965 to promote exports. This was the first EPZ not only in India but in all of Asia as well.
Special Economic Zones Act, 2005
“It is defined as an Act to provide for the establishment, development and management of the Special Economic Zones for the promotion of exports and for matters connected therewith or incidental thereto.”
The chief objectives of the SEZ Act are:
- To create additional economic activity.
- To boost the export of goods and services.
- To generate employment.
- To boost domestic and foreign investments.
- To develop infrastructure facilities.
SEZ Rules
- Simplified procedures to develop, operate and maintain SEZs and also to set up units and conduct businesses in the SEZs.
- Single-window clearance to set up a Special Economic Zone, and also to set up a unit in an SEZ.
- Single-window clearance for matters connected to the Central and State governments.
- Simplified compliance procedures and documentation with a focus on self-certification.
- Different minimum land requirements for different classes of Special Economic Zones.
SEZ Approval Mechanism
The SEZ approval mechanism is a single-window process provided by a 19-member inter-ministerial SEZ Board of Approval (BoA).
- The developer has to submit the proposal to the state government.
- The state government forwards this proposal to the BoA along with its recommendation within forty-five days.
- The developer or applicant can also directly submit the proposal to the BoA.
- The Board, which has been constituted by the Central Government, and is a 19-member Board takes the decision considering the merits of the proposal. All decisions taken by the Board are by consensus.
- The Board is chaired by the Secretary of the Dept. of Commerce, Ministry of Commerce and Industry.
- The other members are from various bodies and ministries such as the Central Board of Excise and Customs (CBEC), the Central Board of Direct Taxes (CBDT), Department of Economic Affairs, Dept. of Commerce, Ministry of Science and Technology, Ministry of Home Affairs, Ministry of Law and Justice, Ministry of Urban Development, etc.
- Once the BoA gives its approval, and the central government notifies the area of the SEZ, units are allowed to be established inside the SEZ.
SEZs Facilities & Incentives
The government offers many incentives for companies and businesses established in SEZs. some of the important ones are:
- Duty-free import or domestic procurement of goods for developing, operating and maintaining SEZ units.
- 100% Income tax exemption on export income for SEZ units under the Income Tax Act for first 5 years, 50% for next 5 years thereafter and 50% of the ploughed back export profit for next 5 years. (Sunset Clause for Units will become effective from 2020).
- Units are exempted from Minimum Alternate Tax (MAT).
- They were exempted from Central Sales Tax, Service Tax and State sales tax. These have now subsumed into GST and supplies to SEZs are zero-rated under the IGST Act, 2017.
- Single window clearance for Central and State level approvals.
- There is no need for a license for import.
- In the manufacturing sector, barring a few segments, 100% FDI is allowed.
- Profits earned are permitted to be repatriated freely with no need for any dividend balancing.
- There is no need for separate documentation for customs and export-import policy.
- Many SEZs offer developed plots and ready-to-use space.
Apart from the firms operating in SEZs, developers of SEZs also receive many benefits and incentives from the government.
SEZs in India
Currently, about 230 are operational in the country. About 64% of the SEZs are located in five states – Tamil Nadu, Telangana, Karnataka, Andhra Pradesh and Maharashtra.
| SEZs approved | 417 |
| SEZs notified | 349 |
| SEZs approved in-principle | 33 |
| SEZs operational | 238 |
| Aas of Sep 2019 | 5168 |
In 2018 – 19, about 20 lakh jobs were created through SEZs. Most of the SEZs being set up are primarily private investment-driven.
In the financial year 2017 – 18, the exports from SEZs have grown by about 13% when compared to the previous financial year.
Examples: SEEPZ Special Economic Zone (Mumbai), Kandla SEZ, Cochin SEZ, Madras SEZ, Visakhapatnam SEZ, NOIDA Export Processing Zone, Falta SEZ, etc.
Challenges
- Since SEZs offer a wide range of incentives and tax benefits, it is believed that many existing domestic firms may just shift base to SEZs.
- There is a fear that the promotion of SEZs may be at the cost of fertile agricultural land affecting food security, loss of revenue to the exchequer and cause uneven growth with adverse effects.
- Apart from food security, water security is also affected because of the diversion of water use for SEZs.
- SEZs also cause pollution, especially with the release of untreated effluents. There has been a huge destruction of mangrove in Gujarat affecting fisheries and dairy sectors.
- SEZs have to be promoted but not at the cost of the agricultural sector of the country. It should also not affect the environment adversely.
India’s Industrial Policy
- Government action to influence the ownership & structure of the industry and its performance.
It takes the form of paying subsidies or providing finance in other ways, or of regulation. - It includes procedures, principles (i.e., the philosophy of a given economy), policies, rules and regulations, incentives and punishments, the tariff policy, the labour policy, government’s attitude towards foreign capital, etc.
Objectives
The main objectives of the Industrial Policy of the Government in India are:
- to maintain a sustained growth in productivity;
- to enhance gainful employment;
- to achieve optimal utilisation of human resources;
- to attain international competitiveness; and
- to transform India into a major partner and player in the global arena.
Industrial Policies in India since Independence
Industrial Policy Resolution of 1948
It defined the broad contours of the policy delineating the role of the State in industrial development both as an entrepreneur and authority.
It made clear that India is going to have a Mixed Economic Model.
It classified industries into four broad areas:
- Strategic Industries (Public Sector):It included 3 industries in which Central Government had monopoly. These included Arms and ammunition, Atomic energy and Rail transport.
- Basic/Key Industries (Public-cum-Private Sector):6 industries viz. coal, iron & steel, aircraft manufacturing, ship-building, manufacture of telephone, telegraph & wireless apparatus, and mineral oil were designated as “Key Industries” or “Basic Industries”.
- These industries were to be set-up by the Central Government.
- However, the existing private sector enterprises were allowed to continue.
- Important Industries (Controlled Private Sector):It included 18 industries including heavy chemicals, sugar, cotton textile & woollen industry, cement, paper, salt, machine tools, fertilizer, rubber, air and sea transport, motor, tractor, electricity etc.
- These industries continue to remain under private sector however, the central government, in consultation with the state government, had general control over them.
- Other Industries (Private and Cooperative Sector):All other industries which were not included in the above mentioned three categories were left open for the private sector.
The Industries (Development and Regulation) Actwas passed in 1951 to implement the Industrial Policy Resolution, 1948.
Industrial Policy Statement of 1956
- Government revised its first Industrial Policy (i.e.the policy of 1948) through the Industrial Policy of 1956.
- It was regarded as the “Economic Constitution of India” or “The Bible of State Capitalism”.
- The 1956 Policy emphasized the need to expand the public sector, to build up a large and growing cooperative sector and to encourage the separation of ownership and management in private industries and, above all, prevent the rise of private monopolies.
- It provided the basic framework for the government’s policy in regard to industries till June 1991.
- IPR, 1956 classified industries into three categories
- Schedule A – consisting of 17 industries was the exclusive responsibility of the State. Out of these 17 industries, four industries, namely arms and ammunition, atomic energy, railways and air transport had Central Government monopolies; new units in the remaining industries were developed by the State Governments.
- Schedule B – consisting of 12 industries, was open to both the private and public sectors; however, such industries were progressively State-owned.
- Schedule C –All the other industries not included in these two Schedules constituted the third category which was left open to the private sector. However, the State reserved the right to undertake any type of industrial production.
- The IPR 1956, stressed the importance of cottage and small scale industries for expanding employment opportunities and for wider decentralization of economic power and activity
- The Resolution also called for efforts to maintain industrial peace;a fair share of the proceeds of production was to be given to the toiling mass in keeping with the avowed objectives of democratic socialism.
- Criticism:The IPR 1956 came in for sharp criticism from the private sector since this Resolution reduced the scope for the expansion of the private sector significantly.
The sector was kept under state control through a system of licenses.
Industrial Licenses
- In order to open new industry or to expand production, obtaining a license from the government was a prerequisite.
- Opening new industries in economically backward areas was incentivised through easy licensing and subsidization of critical inputs like electricity and water. This was done to counter regional disparities that existed in the country.
- Licenses to increase production were issued only if the government was convinced that the economy required more of the goods.
Industrial Policy Statement, 1977
In December 1977, the Janata Government announced its New Industrial Policy through a statement in the Parliament.
- The main thrust of this policy was the effective promotion of cottage and small industrieswidely dispersed in rural areas and small towns.
- In this policy the small sector was classified into three groups—cottage and household sector, tiny sector and small scale industries.
- The 1977 Industrial Policy prescribed different areas for large scale industrial sector-Basic industries,Capital goods industries, High technology industries and Other industries outside the list of reserved items for the small scale sector.
- The 1977 Industrial Policy restricted the scope of large business houses so that no unit of the same business group acquired a dominant and monopolistic position in the market.
- It put emphasis on reducing the occurrence of labour unrest. The Government encouraged the worker’s participation in managementfrom shop floor level to board level.
Criticism:The industrial Policy 1977, was subjected to serious criticism as there was an absence of effective measures to curb the dominant position of large scale units and the policy did not envisage any socioeconomic transformation of the economy for curbing the role of big business houses and multinationals.
Industrial Policy of 1980
sought to promote the concept of economic federation, to raise the efficiency of the public sector and to reverse the trend of industrial production of the past three years and reaffirmed its faith in the Monopolies and Restrictive Trade Practices (MRTP) Act and the Foreign Exchange Regulation Act (FERA).
New Industrial Policy During Economic Reforms of 1991
The long-awaited liberalised industrial policy was announced by the Government of India in 1991 in the midst of severe economic instability in the country. The objective of the policy was to raise efficiency and accelerate economic growth.
Features of New Industrial Policy
- De-reservation of Public sector:Sectors that were earlier exclusively reserved for public sector were reduced. However, pre-eminent place of public sector in 5 core areas like arms and ammunition, atomic energy, mineral oils, rail transport and mining was continued.
- Presently, only two sectors- Atomic Energy and Railway operations-are reserved exclusively for the public sector.
- De-licensing:Abolition of Industrial Licensing for all projects except for a short list of industries.
- There are only 4 industries at present related to security, strategic and environmental concerns, where an industrial license is currently required-
-
- Electronic aerospace and defence equipment
- Specified hazardous chemicals
- Industrial explosives
- Cigars and cigarettes of tobacco and manufactured tobacco substitutes
-
- Disinvestment of Public Sector:Government stakes in Public Sector Enterprises were reduced to enhance their efficiency and competitiveness.
- Liberalisation of Foreign Investment:This was the first Industrial policy in which foreign companies were allowed to have majority stake in India. In 47 high priority industries, upto 51% FDI was allowed. For export trading houses, FDI up to 74% was allowed.
- Today, there are numerous sectors in the economy where government allows 100% FDI.
- Foreign Technology Agreement:Automatic approvals for technology related agreements.
- MRTP Actwas amended to remove the threshold limits of assets in respect of MRTP companies and dominant undertakings. MRTP Act was replaced by the Competition Act 2002.
Outcomes of New Industrial Policies
- The 1991 policymade ‘Licence, Permit and Quota Raj’ a thing of the past. It attempted to liberalise the economy by removing bureaucratic hurdles in industrial growth.
- Limited role of Public sector reduced the burden of the Government.
- The policy provided easier entry of multinational companies,privatisation, removal of asset limit on MRTP companies, liberal licensing.
All this resulted in increased competition, that led to lower prices in many goods such as electronics prices. This brought domestic as well as foreign investment in almost every sector opened to private sector.
- The policy provided easier entry of multinational companies,privatisation, removal of asset limit on MRTP companies, liberal licensing.
- The policy was followed by special efforts to increase exports. Concepts like Export Oriented Units, Export Processing Zones, Agri-Export Zones, Special Economic Zones and lately National Investment and Manufacturing Zones emerged. All these have benefitted the export sector of the country.
Limitations of Industrial Policies in India
- Stagnation of Manufacturing Sector:Industrial policies in India have failed to push manufacturing sector whose contribution to GDP is stagnated at about 16% since 1991.
- Distortions in industrial pattern owing to selective inflow of investments:In the current phase of investment following liberalisation, while substantial investments have been flowing into a few industries, there is concern over the slow pace of investments in many basic and strategic industries such as engineering, power, machine tools, etc.
- Displacement of labour:Restructuring and modernisation of industries as a sequel to the new industrial policy led to displacement of labour.
- Absence of incentives for raising efficiency:Focussing attention on internal liberalisation without adequate emphasis on trade policy reforms resulted in ‘consumption-led growth’ rather than ‘investment’ or ‘export-led growth’.
- Vaguely defined industrial location policy:The New Industrial Policy, while emphasised the detrimental effects of damage to the environment, failed to define a proper industrial location policy, which could ensure a pollution free development of industrial climate.
Way Forward
- Industrial policies in India have taken a shift from predominantly Socialistic pattern in 1956 to Capitalistic since 1991.
- India now has a much liberalised industrial policy regime focusing on increased foreign investment and lesser regulations.
- India ranked 77th on World Bank’s Doing Business Report 2018. Reforms related to insolvency resolution (Bankruptcy and Insolvency Act, 2017) and the Goods and Services Taxes (GST)are impressive and will result in long-term gains for the industrial sector.
- Campaigns such as Make in Indiaand Start up India have helped to enhance the business ecosystem in the country.
- However, electricity shortages and high prices, credit constraints, high unit labour costs due to labour regulations, political interference and other regulatory burdens continue to remain challenges for firm growth of the industrial sector in India.
- There is a need for a new Industrial Policyto boost the manufacturing sector in the country. Government in December 2018 also felt the need to introduce a new Industrial Policy that would be a road map for all business enterprises in the country.
Strategy for New India @ 75
NITI Aayog
Industrial Development
Objectives
- Double the current growth rate of the manufacturing sector by 2022.
- Promote in a planned manner the adoption of the latest technology advancements, referred to as ‘Industry 4.0’, that will have a defining role in shaping the manufacturing sector in 2022.
Current Situation
India is the fifth largest manufacturer in the world with a gross value added (GVA) of INR 21,531.47 billion in 2017-18 (2nd advance estimate for 2017-18 at 2011-12 prices). The sector registered a compound annual growth rate (CAGR) of around 7.7 per cent between 2012-13 and 2017-18.1
The government has taken several initiatives to promote manufacturing. Among these are the Make in India Action Plan aimed at increasing the manufacturing sector’s contribution to 25 per cent of GDP by 2020,2 the Start-up India initia-tive to promote entrepreneurship and nurture innovation, and the Micro Units Development and Refinance Agency (MUDRA) and Stand-up India to facilitate access to credit. It has also un-dertaken massive recapitalisation of public sector banks3 to ease availability of credit to micro, small and medium enterprises (MSMEs). Besides, it has undertaken major infrastructure projects, such as the setting up of industrial corridors, to boost manufacturing.
The Department of Industrial Policy & Promotion (DIPP) has been engaging with states/UTs to enhance the ease of doing business. Following concerted efforts of the government, the World Bank ranked India 100th among 190 countries in the Ease of Doing Business (EODB) in 2018. This was a jump of 34 positions since 2014.
While these indices are useful for comparison, actual improvement in EODB will come only with greater coordination between the centre and states.
The foreign direct investment (FDI) regime has been substantially liberalized, significantly improving India’s rank in terms of annual FDI inflows from 14 in 2010 to 9 in 2017. However, India receives only 25 per cent of the FDI that China gets and only 10 per cent of what the USA receives. FDI inflows into the manufacturing sector reached about 35 per cent of total FDI.4
Manufacturing as a percentage of the gross domestic product has remained at about 16 per cent. Improvement are evident in recent quarters, where manufacturing growth at 6.9 per cent and 8.1 per cent in Q2 and Q3 2017-18 (year-on-year as compared to 2016-17) outpaced GDP growth. Figure 4.1 shows the trend in manufacturing as a percentage of GVA from 2011-12 until 2017-18.
Constraints
The main constraints on achieving the objectives set for India’s industry in 2022-23 are the following:
- Regulatory uncertainty: Regulatory risks and policy uncertainty in the past have dented investor confidence.
- Investment: There has been a cyclical slow-down in fresh investment since 2011-12.
- Technology adoption: The adoption of new technologies like artificial intelligence, data analytics, machine-to-machine communications, robotics and related technologies, collectively called “Industry 4.0”, are a bigger challenge for SMEs than for organized large-scale manu-facturing. Data security, reliability of data and stability in communication/transmission also pose challenges to technology adoption.
- Exports and insufficient domestic demand:
There has been no export driven industrial growth. Domestic demand alone may not be ad-equate for sustained, high value manufacturing.
Challenges to doing business: Despite recent improvements in our global EODB rank, it continues to be a drag on the system. This is also true of investment conditions in the states. Getting construction permits, enforcing con-tracts, paying taxes, starting a business and trading across borders continue to constrain doing business.
Way Forward
Demand generation, augmentation of industrial infrastructure and promotion of MSMEs
- The government can play a crucial role in creating domestic manufacturing capabilities by leveraging proposed public procurement and projects. Mega public projects such as Sagarmala, Bharatmala, industrial corridors, and the Pradhan Mantri Awas Yojana (PMAY) can stimulate domestic manufacturing activities provided the projects are suitably structured and demand is aggregated strategically. This should be accompanied by simplification of the regulatory process. The Madhepura Electric Locomotive Project, a joint venture between the Indian Railways and the French multinational Alstom, provides a good example of how mega projects can be leveraged to boost domestic production. The project enabled effective transfer of technology and the availability of state-of-the-art locomotives for the railways. The Madhepura model is replicable in the defence, aerospace, railways and shipping sectors.
- Set up a portal to monitor projects beyond a given threshold so that any roadblocks are identified and addressed on a real time basis.
- State governments should be encouraged or incentivized to contribute data to this portal. NITI Aayog’s Development Monitoring and Evaluation Office (DMEO) can help set up the portal. An inter-ministerial body with representatives of state governments and project promoters (as special invitees) may be constituted.
- Efforts should be made to develop self-sufficient clusters of manufacturing competence, with Cluster Administrative Authorities empowered to provide single window clearances to entrepreneurs and investors. Industrial corridors should address the lack of infrastructure and logistics. Logistics will need to be supplemented with warehousing and other elements of the manufacturing supply chain.
- NITI Aayog could work with states to prepare manufacturing clusters and develop export strategies based on their sector competitiveness and resource strengths. A cluster should have supporting industries and infrastructure. It should also develop a local brand and distribution channel through an e-commerce platform. A Cluster Administration Office should be given the responsibility to award factory permissions and compliances.
- For India to become the world’s workshop, we should encourage further FDI in manufacturing, particularly when it is supported with buybacks and export orders.
- Streamline discretionary powers vested at different levels of governance by adopting digitized processes and making all approvals electronic in a transparent, time bound manner.
- Disruptive technology, while leading to job losses in traditional areas, also presents new job opportunities. A greater connect between government-industry-academia is required to identify the changing requirements in manufacturing and prepare an employable workforce. In the context of employability of engineers, there is a need for thorough review of standards of engineering education and its linkages with industry.
- E-commerce can be the driver of overall economic growth over the next decade through its impact on generating demand, expanding manufacturing, employment generation and greater transparency. A Committee, chaired by CEO, NITI Aayog examined issues related to the e-commerce industry5. It made recommendations for the sector’s growth including increasing internet access, digitizing payments, further improving transportation infrastructure, logistics and distributed warehousing support. These may be examined for implementation at the earliest.
- Harmonize Indian quality standards with global standards in many sectors. Lack of harmoniza-tion has affected Indian exports and prevented the leveraging of trade agreements adequately.
- For e.g., the medical device industry would benefit greatly from conformity to standards that are essential for new products to be acceptable to doctors and patients abroad. The issues of regulations and standards setting are also intertwined. The following initiative is required in this regard:
- Task the Bureau of Indian Standards and Quality Council of India with assessing the improvements in standards and productivity required to achieve global standards.
- Address the following issues in respect of MSMEs:
- Setting up of mega parks and manufacturing clusters in labour intensive sectors with common facilities to reduce costs and improve quality. It is also recommended that state governments should set up plug and play parks (flatted factories) to ensure international productivity standards.
- Workers of industrial units in the new mega parks should have decent accommodation within reasonable proximity of the work place.
- An expert committee should examine sector-specific pain points and make its recommendations within three months.
- The Department of Public Enterprises (DPE) should ensure registration of all public sector units (PSUs) on the Trade Receivables Discounting System (TREDS) portal.
- Initiate a small business research programme in some select ministries for encouraging R&D in MSMEs.
Industry 4.0
- Launch a major initiative to push industry to adopt Industry 4.0. Industry 4.0 is characterized by increasing digitization and interconnection of products, value chains and business models. It will significantly impact sectors like automobile, pharmaceuticals, chemicals and financial ser-vices and will result in operational efficiencies, cost control and revenue growth. Experts feel that emerging markets like India could benefit tremendously from the adoption of Industry 4.0 practices.
- In his 2018 Budget Speech, the Finance Minister mandated NITI Aayog to initiate a national programme directing India’s efforts on Artificial Intelligence. On a similar note, NITI Aayog could organize a discussion on “Industry 4.0,” inviting leading manufacturing companies from various sectors including automobile/auto components, electrical and electronics, chemicals, cement/steel, etc., along with concerned ministries to discuss plans for adopting Industry 4.0.
- The Indian Institute of Science, a few select In-dian Institutes of Technology (IITs), National Institutes of Technology (NITs) and other premier engineering colleges should create specialized training programmes on ‘Smart Manufacturing’ to address the shortage of high-tech human resources.
- The Department of Heavy Industry (DHI) should develop the Central Manufacturing Technology
Institute (CMTI), Bangalore, as a Centre of Excellence for pursuing R&D in Industry 4.0 technologies and systems. The Department of Science & Technology should spearhead industry-academia R&D projects on cyber physical systems.
UPSC_Pre_MCQ
Match List I with List II and select the correct answer using the codes given below the lists:[1998]
List-I (Places) List-II (Industries)
A.Jamnagar 1.Aluminium
B.Hospet 2.Woollen textile
C.Korba 3.Fertilizers
D.Haldia 4.Cement 5. Iron and steel
Codes: (a)A-4; B-3; C- 1; D-2 (b)A-2; B-5; C- 1; D-3 (c)A-4; B-5; C- 2; D-1 (d)A-2; B-1; C- 4; D-3
Ans.(b)PlacesIndustriesState A.JamnagarWoollen textilesGujarat B.HospetIron and Steel Industry C.KorbaAluminium Chhattisgarh Industry D.HaldiaFertilizersAssam
In the vicinity of Mumbai, a number of specialised towns have been developed. Match the lists of specialisation with towns and select the correct answer using the codes given below the lists:[1998]
List-I (Towns) List-II (Specialisation)
A. Alibag 1.Fishing centre
B. Balapur 2.Holiday resort
C. Nhava Sheva 3.Petrochemical complex
D. Ratnagiri 4.Port
Codes: (a)A-1; B-3; C-2; D-4 (b)A-2; B-3; C-4; D-1 (c)A-3; B-4; C-2; D-1 (d)A-2; B-1; C-4; D-3
Ans.(d)A libag –Holiday Resort Balapur –Fishing Centre Nhave Sheva –Port Ratnagiri –Petrochemical complex
Match List-I (Centre of Handicrafts) with List-II (State) and select the correct answer using the codes given below the lists:[2006] List-IList-II (Centre of Handicrafts)(State) A.Mon1.Arunachal Pradesh B.Nalbari 2.Assam C.Naisghat 3.Meghalaya D.Tura4.Nagaland Codes (a)A-4; B-2; C-1; D-3 (b)A-1; B-3; C-4; D-2 (c)A-4; B-3; C-1; D-2 (d)A-1; B-2; C-4; D-3
Ans.(a)
With reference to the steel industry in India in the recent times, consider the following statements:[2007] 1.Vizag Steel Plant (RINL) has been declared a Mini Ratna. 2.Merger of IISCO with SAIL has been completed. Which of the statements given above is/are correct? (a)1 only (b)2 only (c)Both 1 and 2 (d)Neither 1 nor 2
Ans.(c)Vizag Steel Plant was declared as a Mini Ratna company on 11th Feb 2006. Merger of IISCO with SAIL has been completed on 29th September 2004.
Match List I with List II and select the correct answer using the code given below the lists:[2007] List-I List-II (Aluminium Company) (Location) A.BALCO1.Hirakud B.HINDALCO2.Korba C.Indian Aluminium 3.Koraput Company D.NALCO4.Renukoot Code : (a)A-3; B-1; C-4; D-2 (b)A-2; B-4; C-1; D-3 (c)A-3; B-4; C-1; D-2 (d)A-2; B-1; C-4; D-3
Ans.(b)
Consider the following towns of India:[2014 – I] 1.Bhadrachalam 2.Chanderi 3.Kancheepuram 4.Karnal
Which of the above are famous for the production of traditional sarees/ fabric? (a)1 and 2 only (b)2 and 3 only (c)1, 2 and 3 (d)1,3 and 4.
Ans.(b)Chanderi in Madhyapradesh and Kancheepuram in Tamil Nadu are famous for Silk sarees
.
Agriculture
Overview
Salient Features
Some of the outstanding features of Indian agriculture are mentioned as follows.
1. Subsistence agriculture:
Most parts of India have subsistence agriculture. The farmer owns a small piece of land, grows crops with the help of his family members and consumes almost the entire farm produce with little surplus to sell in the market.
This type of agriculture has been practiced in India for the last several hundreds of years and still prevails in spite of the large scale changes in agricultural practices after Independence.
2. Pressure of population on agriculture:
The population in India is increasing at a rapid pace and exerts heavy pressure on agriculture. Agriculture has to provide employment to a large section of work force and has to feed the teeming millions. While looking into the present need of food grains, we require an additional 12-15 million hectares of land to cope with the increasing demands by 2010 A.D. Moreover, there is rising trend in urbanization.
Over one-fourth of the Indian population lived in urban areas in 2001 and it is estimated that over one-third of the total population of India would be living in urban areas by 2010 A.D. This requires more land for urban settlements which will ultimately encroach upon agricultural land. It is now estimated that about 4 lakh hectares of farm land is now being diverted to non-agricultural uses each year.
3. Importance of animals:
Animal force has always played a significant role in agricultural operations such as ploughing, irrigation, threshing and transporting the agricultural products. Complete mechanisation of Indian agriculture is still a distant goal and animals will continue to dominate the agricultural scene in India for several years to come.
4. Dependent upon Monsoon:
Indian agriculture is mainly dependent upon monsoon which is uncertain, unreliable and irregular. In spite of the large scale expansion of irrigation facilities since Independence, only one-third of the cropped area is provided by perennial irrigation and the remaining two-third of the cropped area has to bear the brunt of the vagaries of the monsoons.
5. Variety of crops:
India is a vast country with varied types of relief, climate and soil conditions. Therefore, there is a large variety of crops grown in India. Both the tropical and temperate crops are successfully grown in India. Very few countries in the world have a variety of crops comparable to that produced in India.
6. Predominance of food crops:
Since Indian agriculture has to feed a large population, production of food crops is the first priority of the farmers almost everywhere in the country. More than two-thirds of the total cropped area is devoted to the cultivation of food crops. However, with the change in cropping pattern, the relative share of food crops came down from 76.7 per cent in 1950-51 to 58.8 per cent in 2002-03.
7. Insignificant place to given fodder crops:
Although India has the largest population of livestock in the world, fodder crops are given a very insignificant place in our cropping pattern. Only four per cent of the reporting area is devoted to permanent pastures and other grazing lands. This is due to pressing demand of land for food crops. The result is that the domestic animals are not properly fed and their productivity is very low compared to international standards.
8. Seasonal pattern:
India has three major crop seasons.
(i) Kharif season starts with the onset of monsoons and continues till the beginning of winter. Major crops of this season are rice, maize, jowar, bajra, cotton, sesamum, groundnut and pulses such as moong, urad, etc.
(ii) Rabi season starts at the beginning of winter and continues till the end of winter or beginning of summer. Major crops of this season are wheat, barley, jowar, gram and oil seeds such as linseed, rape and mustard.
(iii) Zaid is summer cropping season in which crops like rice, maize, groundnut, vegetables and fruits are grown. Now some varieties of pulses have been evolved which can be successfully grown in summer.
The share of agriculture and allied sectors in gross value added (GVA) declined from 18.2 per cent in 2012-13 to 16.4 per cent in 2017-18 (1st AE).
The share of livestock in GVA of agriculture has been rising since 2011-12, while that of the crop sector declined from 65 per cent in 2011-12 to 60 percent in 2015-16.
As per the fourth Advance Estimates for 2016-17 released by Department of Agriculture, Cooperation and Farmers’ Welfare, India achieved a record production of food grains estimated at 275.7 million tonnes during 2016-17.
As per the 1” AE released on 2 2” September 2017, food grains production for the Kharif Season during 2017-18 is estimated at 134.7 million tonnes, lower by 3.9 million tonnes as compared to 2016-17.
The total production of rice during 2017-18 is estimated at 94.5 million tonnes vis-a-vis 96.4 million tonnes (4th Advance Estimates) in 2016-17.
- The production of pulses during 2017-18 is estimated at 8.7 million tonnes, sugarcane at 337.7 million tonnes, oilseeds at 20.7 million tonnes and cotton at 32.3 million bales of 170 kgs each.
- India ranks first, with 9.6 per cent (179.8 Mha) of the global net cropland area according to United States Geological Survey, 2017.
- Agricultural productivity is determined by the appropriate use of critical inputs like irrigation, seeds, fertilisers, credit, machines, technology and extension services. As reported in input survey (2011-12), out of total operational holdings, only 9.4 per cent used certified seeds, 27 per cent used seeds of notified variety and only 9.8 per cent used hybrid seeds.
- The All India percentage of net irrigated area to total cropped area was 34.5 per cent in 2014-15, which makes a large part of agriculture in India dependent on rainfall.
- Pradhan Mantri Knshi Sinchayee Yojana (PMKSY) is being implemented in mission mode with the help of Command Area Development to complete 99 major and medium irrigation projects covering 76.0 lakh hectares in a phased manner by December 2019 to increase the coverage of irrigated area and thereby agricultural productivity.
- The NSSO Report (July2012 — June 2013) had indicated that a very small share of agricultural households engaged in crop production activities were insuring their crops.
- During Kharif 2016 season, 23 States implemented PMFBY and during Rabi season of 2016-17, 25 States/Union Territories implemented PMFBY.
- As on December 2017, total claims of Rs. 13292 crore have been approved for 116 lakhs farmers (applications) and Rs. 12020 crore have been paid under PMFBY.
Land use Pattern
- Cropped area in the year under consideration is called Net Sown Area.
- The net sown area occupies as follows:
- Highest category (above 55% of the reporting area) in Punjab, Haryana, West Bengal, Maharashtra, Uttar Pradesh, Bihar and Kenia.
- Medium category (30-55%) in Karnataka, Gujarat, Tamil Nadu, Rajasthan, Madhya Pradesh, Andhra Pradesh, Chhattisgarh, Orissa, Goa and Assam.
- Low category (below 30%) in Himachal Pradesh, Jammu and Kashmir, Meghalaya, Nagaland, Manipur, Jharkhand, Uttarakhand, Mizoram and Arunachal Pradesh.
Area sown more than once: This area is used to grow more than one crop in a year. This accounts for 3 4.3% of the net sown area and 16.6% of the total reporting area of the country. This type of area comprises land with rich fertile soil and regulars water supply.
Forests: It is the area which the govt. has identified & demarcated for forest growth.
Land not available for cultivation: This class consists of two types of land
(i) Land put to non-agricultural uses
(ii) Barren and unculturable waste
Permanent pastures and other grazing land: It amounts to about 3.45% (i.e. 11.8 mha) of the total reporting area. The area presently under pastures is not sufficient keeping in view the large population of livestock in the country.
Land under miscellaneous tree crops and groves: It includes all cultivable land which is not included under net area sown, but is put to some agricultural use.
Culturable Wasteland: It includes all lands available for cultivation, but not cultivated for one reason or the other.
The history of Agriculture in India dates back to Indus Valley Civilization Era and even before that in some parts of Southern India.India ranks second worldwide in farm outputs. As per 2018, Agriculture employed 50% of the Indian work force and contributed 17-18% to country’s GDP.
In 2016. Agriculture and allied sectors like animal husbandry, forestry and fisheries accounted for 15.4% of the GDP (gross domestic product) with about 31% of the workforce in 2014. India ranks first globally with highest net cropped area followed by US and China. The economic contribution of agriculture to India’s GDP is steadily declining with the country’s broad-based economic growth. Still, agriculture is demographically the broadest economic sector and plays a significant role in the overall socio-economic fabric of India.
India exported $38 billion worth of agricultural products in 2013, making it the seventh largest agricultural exporter worldwide and the sixth largest net exporter. Most of its agriculture exports serve developing and least developed nations. Indian agricultural/horticultural and processed foods are exported to more than 120 countries, primarily in the Middle East, Southeast Asia, SAARC countries, the European Union and the United States.
As per the 2014 FAO world agriculture statistics India is the world’s largest producer of many fresh fruits like banana, mango, guava, papaya, lemon and vegetables like chickpea, okra and milk, major spices like chili pepper, ginger, fibrous crops such as jute, staples such as millets and castor oil seed.
India is the second largest producer of wheat and rice, the world’s major food staples.
India is currently the world’s second or third largest producer of several dry fruits, agriculture-based textile raw materials, roots and tuber crops, pulses, farmed fish, eggs, coconut, sugarcane and numerous vegetables. India ranked in the world’s five largest producers of over 80% of agricultural produce items, including many cash crops such as coffee and cotton, in 2010. India is one of the world’s five largest producers of livestock and poultry meat, with one of the fastest growth rates, as of 2011.
One report from 2008 claimed India’s population is growing faster than its ability to produce rice and wheat. Other recent studies claim India can easily feed its growing population, plus produce wheat and rice for global exports, if it can reduce food staple spoilage, improve its infrastructure and raise its farm productivity to those achieved by other developing countries such as Brazil and China.
Types of Farming
India is a vast country and had various climatic patters and geographical condition, so these are different types of farming.
1. Subsistence Farming In this type of farming farmer produce for his own consumption. These is no surplus left for sale. This involves cultivation of food crops like rice, wheat, pulses etc.
2. Commercial Farming In this farming, food crops produced specifically for sale in the market by using improved variety of seeds and machinery. Normally it is characterised by large farms and only one crop is grown. Advance machinery chemical fertilizers, hybrid seeds and pesticides are used. Cotton, sugarcane, tobacco, oil seeds, chiffles etc. are commercial crops.
3. Shifting Cultivation: Shifting cultivation means the migratory subsistence farming. Under this system, a plot of land is cultivated for few years and when the crop yield declines the plot of land is changed. Dry paddy, buck wheat, maize, small millets, tobacco & sugarcane are the main crops grown under this type of agriculture. It is known by different names in different parts of the country. It is “Jhumming” in—north eastern states; ‘podu’ in Andhra Pradesh, ‘Bewar’ in MP., ‘Ku-mari’ in Western Ghats.
4. Mixed Farming: Mixed farming is raising of crops and rearing of cattle, poultry, bee keeping, sen culture etc. on the same cattle or poultry do not need extra expenditure as they thrive on the farm wasters. Livestocks animals provide substitute income when crops are not ready. This type of farming is done in densely populated areas.
5. Plantation Farming: Predominance of a single crop (only for sale) farming in tropical regions is called plantation farming. Important crops grown under this type of farming are cotton, tea, rubber, spices, coconuts etc. This farming outlay. Latest knowledge and modern methods of agriculture are used in this farming.
6. Intensive Agriculture: System of cultivation using large amount of labour and capital with application of fertilizers and insecticides is called intensive agriculture. Use of high efficiency machinery for planting, cultivating and harvesting as well as latest irrigation equipment.
7. Extensive Agriculture: System of crop cultivation using small amounts of labour and capital in relation to area of land being farmed. The crop yield in extensive agriculture depends primarily on the natural fertility of the soil, terrain climate and the availability of water.
First Green Revolution
The term “Green Revolution” is applied to the period from 1967 to 1978. The green revolution started by Dr. Norman Bortaug in Mexico and Dr. M.S. Swaminathan in India. Between 1947 and 1967, efforts at achieving food self sufficiency were not entirely successful. Population was growing at a much faster rate than good production. This called for drastic action to increase yield.
The action came in the form of the green revolution. The term green revolution is a general one that is applied to successful agricultural experiments in many countries. But it was most successful in India.
There were three basic elements in India regarding Green revolution
Continued expansion of farming areas.
Double cropping of existing farm and
Using new and scientific treated seeds with improved genetics.
Components of the Green Revolution
High yield varieties (seeds), irrigation, use of fertilizers, use of insecticide and pesticide, command area development, consolidation of holding, land reform, supply of agricultural credit, rural electrification, rural roads and marketing, farm mechanisation, agricultural universities.
Impacts of Green Revolution
Impacts of Green Revolution are as follows
Positive Impact Increase in agricultural production, reduction of the import of food grains, capitalistic farming, industrial growth and rural employment.
Negative Impact Inter-crop imbalance, increase in regional imbalance, unemployment due to mechanisation. Increase in interregional migration, ecological problems and social conflict between large and small farmers.
Second Green Revolution
The current growth rate of agricultural sector n Indian economy is only 2-3% per year. It’s productivity is much below of international standards. On the other hand the need for foods constantly growing due to increasing population and changing dietary habits. We are also talking about implementing the Right to Food for everybody. The challenge of food security is being threatened by the effects of climate change as well as growing use of bio fuels made from food crops such as maize. Against these odds, we have already used up most of the cultivable land. There is no scope for bringing new land under cultivation. All these factors demand from us to increase the productivity from available land. There is a need to raise it by launching Second Green Revolution. The Second Green Revolution would have to be knowledge based, scientifically managed and should improve agricultural efficiency. National Commission on Farmers 2005, Eleventh Five Year Plan, etc. have given their suggestions on Second Green Revolution. The Government too has initiated many programmes and set targets in this direction. Some suggestions and initiatives are given below:
1. Sustainable farm profitability by embracing the entire agro-economy from the farmer to consumer.
2. Introduction of new technologies such as Information Technology, Nanotechnology, Biotechnology, Genetic Engineering, water efficient irrigation systems; environment friendly pesticides, precision agriculture/farming organic farming, biodynamic farming .
3.Massive crop diversification and multiple cropping is one of the key features of second green revolution.
4. Self-sufficiency in pulses and oil seeds and doubling horticulture and floriculture would be doubled in five years.
5. Promoting ecosystem of food production, food processing and marketing.
6.Second green revolution look after local geographical and climatic position, soil fertility and nature.
7. Massive crop diversification and multiple cropping.
Revolutions Area
- Green Revolution — Agriculture (Food Production)
- Yellow Revolution — Oil seeds production (Edible oil)
- White Revolution — Milk
- Blue Revolution — Fish
- Pink Revolution — Shrimp, food processing
- Brown Revolution — Coffee/Cocoa
- Red Revolution — Meat/Tomato
- Golden Revolution — Fruits/Apple/Honey/Horticulture
- Grey Revolution — Fertilizers
- Silver Revolution — Eggs/Poultry
- Golden — Fibre Jute
- Silver – Fibre Cotton
Cropping seasons
- Kharif
- Rabi
- Zaid
Kharif Crops
- Also known as Monsoon / Summer Crops
- Requires plenty of water
- Require long hot weather for growth
- Sown → May – July , Harvest → Sep – Oct
- Harvest – Beginning of November
- Major Crops → Paddy, Sugarcane, Maize, Jowar, Bajra, Cotton, Pulses, Groundnut, Soybean, Sunflower, Tea, Coffee, Rubber, Sesame, Guar etc.
Rabi Crops
- Also known as Winter Season Crops
- Requires less water
- Require cold weather for growth
- Sown → Oct – Nov,
- Harvest → Feb – April
- Major Crops → Wheat, Gram, Potato, Peas, Oil seeds (Rapeseed, linseed), Mustard etc.
Zaid Crops
- Sown between Rabi & Kharif crops i.e. from March to June
- Requires warm dry weather for growth & longer day length for flowering
- Major Crops → Seasonal fruits & vegetables (Musk melon, Water melon, Cucumber, China Paddy, Gourds, Fodder crops)
Largest agricultural products in India by value
Column 1 – Rank
Column 2 – Commodity
Column 4 – Value (US$, 2013)
Column 5 – Unit price (US$ / kilogram, 2009)
Column 6 – Average yield (tonnes per hectare, 2010)
Column 7 – Most productive country (tonnes per hectare, 2010)
| 1 | 2 | 3 | 4 | 5 | 6 | 7 |
| 1 | Rice | $42.57 b | 0.27 | 3.99 | 12.03 | Australia |
| 2 | B. milk | $27.92 b | 0.4 | 0.63 | 23.7 | India |
| 3 | Cow milk | $18.91 b | 0.31 | 1.2 | 10.3 | Israel |
| 4 | Wheat | $13.98 b | 0.15 | 2.8 | 8.9 | Netherlands |
| 5 | Mangoes, guavas |
$10.79 b | 0.6 | 6.3 | 40.6 | Cape Verde |
| 6 | Sugar cane | $10.42 b | 0.03 | 66 | 125 | Peru |
| 7 | Cotton | $8.65 b | 1.43 | 1.6 | 4.6 | Israel |
| 8 | Bananas | $7.77 b | 0.28 | 37.8 | 59.3 | Indonesia |
| 9 | Potatoes | $7.11 b | 0.15 | 19.9 | 44.3 | United States |
| 10 | Tomatoes | $6.74 b | 0.37 | 19.3 | 55.9 | China |
| 1 | Commodity | Value (US$, 2013) |
4 |
5 |
6 |
7 |
| 11 | F.Vegetables | $6.27 billion | 0.19 | 13.4 | 76.8 | US |
| 12 | Buffalo meat | $4.33 billion | 2.69 | 0.138 | 0.424 | Thailand |
| 13 | Groundnuts | $4.11 billion | 1.96 | 1.8 | 17.0 | China |
| 14 | Okra | $4.06 billion | 0.35 | 7.6 | 23.9 | Israel |
| 15 | Onions | $4.05 billion | 0.21 | 16.6 | 67.3 | Ireland |
| 16 | Chick peas | $3.43 billion | 0.4 | 0.9 | 2.8 | China |
| 17 | Chicken meat | $3.32 billion | 0.64 | 10.6 | 20.2 | Cyprus |
| 18 | Fresh fruits | $3.25 billion | 0.42 | 1.1 | 5.5 | Nicaragua |
| 19 | Hen eggs | $3.18 billion | 2.7 | 0.1 | 0.42 | Japan |
| 20 | Soybeans | $3.09 billion | 0.26 | 1.1 | 3.7 | Turkey |
Largest agricultural products in India by value
Agriculture productivity in India, growth in average yields from 1970 to 2010
| Crop | Average YIELD 1970-1971 |
Average YIELD 990-1991 |
Average YIELD 2010–2011 |
| kg/hec | kg/ hec | kg/hec | |
| Rice | 1123 | 1740 | 2240 |
| Wheat | 1307 | 2281 | 2938 |
| Pulses | 524 | 578 | 689 |
| Oilseeds | 579 | 771 | 1325 |
| Sugarcane | 48322 | 65395 | 68596 |
| Tea | 1182 | 1652 | 1669 |
| Cotton | 106 | 225 | 510 |
Horticultural productivity in India, 2013
Column 1 – Country
Column 2 – Area under fruits production (million hectares)
Column 3 – Average Fruits Yield (Metric tonnes per hectare)
Column 4 – Area under vegetable production (million hectares)
Column 5 – Average Vegetable Yield (Metric tonnes per hectare)
| Country |
2 |
3 |
4 |
5 |
| India | 7.0 | 11.6 | 9.2 | 52.36 |
| China | 11.8 | 11.6 | 24.6 | 23.4 |
| Spain | 1.54 | 9.1 | 0.32 | 39.3 |
| US | 1.14 | 23.3 | 1.1 | 32.5 |
| World | 57.3 | 11.3 | 60.0 | 19.7 |
Agricultural Regions
Various types of Agricultural Regions of India are as follows:
An agricultural region is defined as an area having homogeneity in relief, soil type, climatic conditions, farming practices, crops produced and crop association.
India is a vast country and is endowed with diverse geographical conditions which are bound to bring in regional variations in agriculture.
Several scholars have attempted to delineate the agricultural regions of India. Prominent among them are E. Simkins (1926), D. Thomer (1956), M.S. Randhawa (1958), L.D. Stamp (1958), Chen Hang-Seng (1959), O.H.K. Spate and A.T.A. Learmonth (1960), Ramchandran (1963), F. Siddiqui (1967), O. Slampa (1968), Miss P. Sengupta (1968), R.L. Singh (1971) and Jasbir Singh (1975) The scheme suggested by the Indian Council for Agricultural Research (ICAR) is simple and comprehensive and is reproduced here. It is based on the predominance of crops and crop associations. Accordingly India can be divided into following agricultural regions:
1. Rice-Jute-Tea Region
This vast region includes lowlands, valleys and river deltas in the states of Assam, Arunachal Pradesh, Tripura, Meghalaya, West Bengal, Orissa, northern and eastern Bihar parts of Jharkhand and Chhattisgarh and Tarai region of Uttar Pradesh.
The rainfall vanes from 180 to 250 cm. Rice are the predominant crop due to fertile alluvial soils, abundant rainfall and high summer temperatures. Jute is mainly grown in the Hugli basin of West Bengal but some areas have been brought under jute cultivation in Assam, Meghalaya, Tripura, Orissa and Tarai region of U.P. Tea is mainly grown in Assam, Darjeeling and Jalpaiguri areas of West Bengal and Tripura. Sugarcane and tobacco are grown in Bihar. Coconut is grown in coastal areas. Mango, pineapple, betal leaves, bananas, jack fruits, and oranges are the main fruit crops.
2. Wheat and Sugarcane Region:
This region comprises Bihar, Uttar Pradesh, Punjab, Haryana, Western Madhya Pradesh and north eastern Rajasthan. Most of the areas have rich fertile alluvial soils with some parts having black and red soils. Rainfall is moderate, large part of which is caused by south-west monsoons in summer. Some rainfall is caused by western disturbances in winter.
Irrigation is a vital input in drier areas. As its name indicates, this region is dominated by wheat and sugarcane cultivation. The main wheat belt of India extends over Punjab, Haryana, Ganga-Yamuna doab of Uttar Pradesh and north-eastern Rajasthan. Sugercane is mainly grown in Uttar Pradesh and contiguous parts of Bihar. Rice, pulses and maize are the other important crops.
3. Cotton Region:
It spreads on the regur or black cotton soil area of the Deccan plateau, where the rainfall varies from 75 to 100 cm. Obviously, cotton is the main crop but jowar, bajra, gram, sugarcane, wheat, etc. are also grown.
4. Maize and Coarse Crops Region:
Western Rajasthan and northern Gujarat are included in this region. The rainfall is scanty and is normally below 50 cm. Agriculture is possible only with the help of irrigation. Maize is mainly grown in the Mewar plateau where wheat and ragi are also produced. In the southern part, rice, cotton and sugarcane are grown. Bajra and pulses are grown throughout the region.
5. Millets and Oilseeds Region:
This region includes areas of poor soils and broken topography in Karnataka plateau, parts of Tamil Nadu, southern Andhra Pradesh and eastern Kerala. The rainfall varies from 75 to 125 cm. The millets include bajra, ragi and jowar while the oilseeds grown are groundnut and caster. Pulses are also grown. Mangoes and bananas are important fruit crops.
6. Fruits and Vegetable Region:
This region extends from Kashmir Valley in the west to Assam in the east. The rainfall varies from 60 cm in the west to 200 cm in the east. Apple, peach, cherries, plum, apricot are grown in the west while oranges are important in the east. Besides, rice, maize, ragi potatoes, chillies and vegetables are also grown.
MAJOR CROPS
Indian crops can be divided into following categories:
. Food crops: Rice, wheat, maize, millets-jowar, bajra etc.
. Cash crops: Cotton, jute, sugarcane, tobacco, groundnut etc.
. Plantation crops: Tea, Coffee, spices, coconut, rubber etc.
. Horticulture crops: Apple, mango, banana, citrus etc.
Food grains
Rice
- Rice is predominantly a Kharif or crop. It covers one third of total cultivated area of India.
- It provides food to more than half of the Indian population. Rice is produced in almost all states.
- Top three producer states are West Bengal, Punjab and Uttar Pradesh.
- Temperature: 22 – 32 C
- Rainfall: 150-300 cm
- Soil: Deep clayey and loamy soil
| SL | Year | Area M hac |
Production M Tonnes |
Yield Kg/Hec |
| 1. | 2000-01 | 30.81 | 20.58 | 668 |
| 2. | 2001-02 | 29.83 | 21.30 | 714 |
| 3. | 2002-03 | 29.97 | 22.90 | 764 |
| 4. | 2003-04 | 31.29 | 28.21 | 902 |
| 5. | 2004-05 | 30.77 | 25.22 | 820 |
| 6. | 2005-2006 | 31.52 | 27.56 | 874 |
Rice Production by States (Million Tonnes)
| States |
Rank |
Ac. Prod |
% |
Cumulative |
A. Prod. |
Estimate (2015-16) |
| India | – | 103.73 | 100.0% | 100% | 105.48 | 103.61 |
| West Bengal | 1 | 14.68 | 13.9% | 14% | 14.54 | 16.10 |
| Uttar Pradesh | 2 | 12.17 | 11.5% | 25% | 13.45 | 12.51 |
| Punjab | 3 | 11.11 | 10.5% | 36% | 11.03 | 11.64 |
| Odisha | 4 | 8.30 | 7.9% | 44% | 7.17 | 5.80 |
| Andhra P | 5 | 7.23 | 6.9% | 51% | 7.34 | 6.94 |
| Bihar | 6 | 6.36 | 6.0% | 57% | 5.93 | 6.11 |
| Chhattisgarh | 7 | 6.32 | 6.0% | 63% | 6.37 | 6.29 |
| Tamil Nadu | 8 | 5.73 | 5.4% | 68% | 5.68 | 5.72 |
| Assam | 9 | 5.22 | 4.9% | 73% | 4.91 | 5.12 |
| Telangana | 10 | 4.44 | 4.2% | 77% | 5.31 | 4.19 |
Wheat
Next to rice, wheat is the most important food-grain of India and is the staple food of millions of Indians, particularly in the northern and north-western parts of the country. India is the 4th largest producer of wheat in the world after Russia, the USA and China and accounts for 8.7 per cent of the world’s total production of wheat.
- Temperature:
- 10-15 degree Celsius (Sowing time);
- 21-26 degree Celsius (Ripening & Harvesting)
- Rainfall: 75-100 cm
- Soil: Deep clayey and loamy soil
Uttar Pradesh, Punjab and Haryana are the three prominent wheat producing states. These states account for about 60 per cent of the wheat area and produce about three-fourths of the total wheat production in India. In fact, Punjab, Haryana and the contiguous western parts of U.P. have earned the distinction of being called the ‘Granary of India’. The other major wheat producing states are Rajasthan, Madhya Pradesh and Bihar.
- India produced 7.3 million tonnes of jowar from 9.5 million hectares of land with an average yield of 772 kg/hectare in 2003-04.
- Maharashtra far excels all other states and produces more than 54 per cent of the total jowar production of India. As many as 22 districts of Maharashtra produce jowar but Osmanabad, Nanded, Yavatmal, Buldhana, Parbhani, Kolhapur, Amravati, and Ahmednagar are important producing districts.
- Karnataka with 18.51 per cent of India’s jowar production is the second largest producer.
- Andhra Pradesh has experienced a decrease in area and production of jowar during the last few years
- Jowar is grown as fodder in some of the south western parts of Uttar Pradesh.
- In Gujarat also, it is grown as fodder in the districts of Surat, Bharuch, Mahsana, and Vadodara. Rajasthan’s dry climate and sandy soil provide favourable conditions for the cultivation of jowar.
- Temperature:
- 27-33 degree Celsius
- Rainfall: 50-100 cm
- Soil: Less sensitive to soil deficiencies.
Millets – Jowar
Jowar is the most important millet. Next to rice and wheat jowar is the third most important food crop both with respect to area and production. Dr. Voelkar has spoken very highly of nutritive value of jowar as a fodder.
- There had been wide fluctuations in the production of bajra from a minimum of 2.6 million tonnes in 1950-51 to a maximum of 11.8 million tonnes in 2003-04. The yields have also varied widely from a minimum of 286 kg/hectare in 1960-61 to a maximum of 1,134 kg/hectare in 2003-04 . Large scale variations in area under bajra cultivation have also been observed.
- Nearly 80 per cent of India’s bajra comes from Maharashtra, Gujarat, Uttar Pradesh and Rajasthan. Maharashtra is the largest producer of bajra in India. In 2002-03 this state produced 11.46 lakh tonnes which was 24.74 per cent of the total production of the country.
- In Maharashtra, bajra is mainly grown in the central plateau having poor soils and dry climate. Nashik, Dhule, Satara, Pune, Sangli, Aurangabad, Solapur, Jalgaon and Ahmednagar are the main producing districts. Neighbouring Gujarat is the second important producer, where 9.07 lakh tonnes (19.58 per cent of India’s total) of bajra was produced in 2002-03.
- Temperature:
- 27-32 degree Celsius
- Rainfall: 50-100 cm
- Soil: Less sensitive to soil deficiencies.
Millets – Bajra
Bajra is the Second most important millet which is used as food in drier parts of the country. It is also widely used as fodder as its stalks are fed to cattle.
Pulses
In India, total pulse area and production during 2017-18 has been >293 lakh hectares (Lha) and 245 lack tonnes (Lt) respectively. Out of the total area, >73 Lha is in Madhya Pradesh alone, earning a prime status in pulse production commodity registering a remarkable 25% of
the country’s pulse area with 33% production, thereby ranking first both in area and production. This is followed by Rajasthan in respect of area (16 per cent) and Maharashtra in case of total production (13 per cent).
pulse crops are cultivated in Kharif, Rabi and Zaid seasons of the Agricultural year.
More than 90 per cent of total pulse production has been the contribution of 10 states
namely, Madhya Pradesh, Maharashtra, Rajasthan, Uttar Pradesh, Karnataka, Andhra
Pradesh, Gujarat, Jharkhand, Tamil Nadu and Telangana.
Cash Crops
Sugar Cane
The global production of raw sugar is 112 m.t. India stands first in area (3.93 m. ha) and production (167 m.t) among the sugarcane growing countries of the world. Uttar Pradesh has the largest area almost 50 per cent of the cane area in the country, followed by Maharashtra, Karnataka, Tamil Nadu, Andhra Pradesh, Gujarat, Bihar, Haryana and Punjab. These nine are most important sugarcane producing states. Sugarcane production is also highest in U.P. followed by Maharashtra. Productivity wise, Tamilnadu stands first with over 100 tonnes per hectare followed by Karnataka, Maharashtra.
- Temperature:
- 21-27 degree Celsius
- Rainfall: 75-150 cm
- Soil: Deep rich loamy soil
Source: United States Department of Agriculture
Fiber
Cotton
Cotton is a kharif crop which requires 6 to 8 months to mature. Its time of sowing and harvesting differs in different parts of the country depending upon the climatic conditions. In Punjab and Haryana it is sown in April-May and is harvested in December-January that is before the winter frost can damage the crop.
In the peninsular part of India, it is sown upto October and harvested between January and May because there is no danger of winter frost in these areas. In Tamil Nadu, it is grown both as a kharif and as a rabi crop.
- Temperature:
- 21-30 degree Celsius
- Rainfall: 50-100 cm
- Soil: Black soil of Deccan and Malwa Plateau. However, it also grows well in alluvial soils of the Sutlej-Ganga plain and red and laterite soils of the peninsular region.
- The growth of cotton is retarded when the temperature falls below 20°C. Frost is enemy number one of the cotton plant and it is grown in areas having at least 210 frost free days in a year.
Types of Cotton:
Three broad types of cotton are generally recognized on the basis of the length, strength and structure of its fibre.
1. Long staple cotton:
It has the longest fibre whose length varies from 24 to 27 mm. About half of the total cotton produced in India is a long staple. It is largely grown in Punjab, Haryana, Maharashtra, Tamil Nadu, Madhya Pradesh, Gujarat and Andhra Pradesh.
2. Medium staple cotton:
The length of its fibre is between 20 mm and 24 mm. About 44 per cent of the total cotton production in India is of medium staple. Rajasthan, Punjab, Tamil Nadu, Madhya Pradesh, Uttar Pradesh, Karnataka and Maharashtra are its main producers.
3. Short staple cotton:
This is inferior cotton with fibre less than 20 mm long. It is used for manufacturing inferior cloth and fetches less price. About 6 per cent of the total production is of short staple cotton. U.P., Andhra Pradesh, Rajasthan, Haryana and Punjab are its main producers.
In spite of the three fold increase in the yield; our yield of 307 kg/hectare is just half of the world average and far below the yield of 731 kg/hectare in the USA, 756 kg/hectare in Pakistan and 816 kg/hectare in Egypt.
Major Cotton Producers in India
1. Maharashtra: Maharashtra is the largest producer and produces 29.78 per cent of the total cotton production of India.
2. Gujarat: Accounting for 19.33 per cent of the total production and 21.33 per cent of the cotton area of the country.
3. Andhra Pradesh: Andhra Pradesh accounts for 12.46 per cent of production and 10.47 per cent of hectarage of India.
4. Punjab: Punjab has slipped from first position in 1990-91 to fourth position in 2002-03 as a producer of cotton in India. This state has the distinction of giving highest yield of 4.1 quintals/hectare (2002-03) which is more than double the national average.
5. Haryana: Accounting for 11.91 per cent production and 6.77 per cent of hectarage, Haryana is the fifth largest producer of cotton in India
Oilseeds
India has the largest area and production of oilseeds in the world. Five major oil seeds viz., groundnut, sesamum, rapeseed and mustard, linseed and castor seed occupied 212.24 lakh hectares (2002-03) which is over 15 percent of the net area sown.
Groundnut
- Temperature:
- 20°-30°C
- Rainfall: 50-75 cm
- Isohyet of 100 cm marks the upper limit of groundnut cultivation. It is highly susceptible to frost, prolonged drought, continuous rain and stagnant water.
- Dry winter is needed at the time of ripening. It can be grown both as a kharif and as a rabi crop but 91 per cent of the total area under groundnut is devoted to kharif crop.
India is the largest producer of groundnut in the world and accounts for about one-third of the world’s production. There had been almost 150 per cent increase in the production of groundnut from 34.8 lakh tonnes in 1950-51 to a record production of 85.6 lakh tonnes in 1992-93.
Gujarat, Tamil Nadu and Andhra Pradesh are the three main producers. These three states together account for over 65 per cent of total production of India. Gujarat is the largest producer contributing over 25 per cent of India’s total production. Tamil Nadu is the second largest producer accounting for over 22 per cent of the total groundnut produced in India. Andhra Pradesh is the third largest producer of groundnut in India and accounts for over 18 per cent of India’s total production.
Sesamum (Til)
- Temperature:
- 21° – 23°C
- Rainfall: 45-50 cm
- It is grown as a kharif crop in the north and as a rabi crop in the south.
India has the world’s largest area under sesamum and is also the largest producer of this crop accounting for one-third of the world production. Since it is a rainfed crop, the production figures show fluctuating trends. But there has been an overall 87 percent increase in its production from 4.5 lakh tonnes in 1950-51 to a record 8.4 lakh tonnes in 1990-91.
Sesamum is produced in almost all parts of the country but Gujarat is the largest producing state. In 2002-03 this state produced over 28 per cent of the total production of India. The other major producers are West Bengal, Maharashtra, Tamil Nadu, Karnataka, Madhya Pradesh, Andhra Pradesh, Uttar Pradesh and Rajasthan.
Rapeseed and Mustard
- Like wheat and gram, they thrive only in cool climate of the Satluj-Ganga plain and very small quantity is grown in the peninsular India. They are mainly grown as rabi crop in pure or mixed form with wheat, gram and barley.
India has the largest area and the highest production of rapeseed and mustard in the world. There has been nearly four-fold increase in their production in three decades from 1960-61 to 1991 after which varying trends of production have been noticed.
Rajasthan and Uttar Pradesh are the two major producers of these two oilseeds and contribute over 53 per cent of the total production of India. Uttar Pradesh has been traditionally the largest producer of rapeseed and mustard but according to 2002-03 figures, Rajasthan has overtaken Uttar Pradesh to become the largest producer. In that year Rajasthan produced 1,318 thousand tonnes (33.64%) against 759 thousand tonnes (19.37%) produced by Uttar Pradesh. Haryana is the third largest producer contributing 694 thousand tonnes (17.71%).
Linseed
- Temperature:
- about 20°C
- Rainfall: 75 cm
- Soil – Clay loams, deep black soils and alluvial soils are best suited for its cultivation.
- It can be cultivated upto a height of 800 metres above sea level. It is a rabi-crop which is sown in Oct-Nov. and harvested in March-April.
India produces about 10 per cent of world’s linseed and is world’s third largest producer after Russia and Canada. However, there had been almost consistent decline in production during the last few years and the production had fallen from 309 thousand tonnes in 1995-96 to 173 thousand tonnes in 2002-03.
Madhya Pradesh is the largest producer accounting for 45 thousand tonnes (26%) of linseed.
Uttar Pradesh is the second largest producer with 37 thousand tonnes (21.4%) of linseed to its credit.
Bihar is the third largest producer of linseed in India. In 2002-03, this state produced 26 thousand tonnes of linseed which was over 15 per cent of the all India production.
Castor Seed
- Temperature:
- 20°-25°C
- Rainfall: 50-75 cm
- Soil – It is grown on red sandy loams in the peninsular India and on light alluvial soils of the Satluj-Ganga plain.
- Almost the whole area of castor seed production is rainfed. It is a kharif crop in the north and a rabi crop in the south.
India is the second largest producer of castor seed after Brazil and produces about one-fifth of the total world production. The production increased from a meagre one lakh tonnes in 1950-51 to all time record of over nine lakh tonnes in 1996-97.
Gujarat is the largest producer of castor seed in India. This state produced 283 thousand tonnes of castor seed out of a total of 428 thousand tonnes produced by the entire country in 2002-03.
Andhra Pradesh was a distant second producer and produced only 85 thousand tonnes (19.9 per cent of all India) in 2002-03.
Beverage
Coffee
India produces about 2.5 percent of world’s coffee on almost the same percentage of coffee plantations. Thus India is an insignificant producer of coffee and stands nowhere when compared with Brazil (25%), Columbia (15%) and Indonesia (7%).
Coffee Arabica and Coffee Robusta are the two main varieties of coffee grown in India accounting for 49 per cent and 51 per cent of area respectively under coffee.
Karnataka is the largest producer accounting for about 70 per cent of total coffee production and 60 percent of the area under coffee in India.
Kerala is the second largest producer of coffee but lags far behind, accounting only for about 23.27 per cent of the total production of the country.
- Temperature:
- 15°C and 28 °C
- Rainfall: 150-250 cm
- Soil: Well drained, deep friable loam soil.
- It does not tolerate frost, snowfall, high temperature above 30°C and strong sun shine and is generally grown under shady trees. Prolonged drought is also injurious to coffee. Dry weather is necessary at the time of ripening of the berries.
- Stagnant water is harmful and this crop is grown on hill slopes at elevations from 600 to 1,600 metres above sea level.
Source: United States Department of Agriculture
Tea
Yield of tea increased by 166.6 per cent, 66.6 per cent and 71 percent respectively between 1960-61 and 2003-04. At present, India is the largest producer and consumer of tea in the world and accounts for around 27 per cent of world production.
Assam is the largest producer of tea accounting for over 51 per cent of the production and over 53 per cent of area under tea cultivation in India.
West Bengal is the second largest producer contributing over 22 per cent of India’s tea from about one-fourth of the country’s total area under tea cultivation.
In South India tea is produced in Nilgiri, Cardamom, Palni and Anaimalai hills in Tamil Nadu, Kerala and Karnataka states extending from 9°N to 14°N latitudes. This region accounts for 25 per cent production and about 24 per cent of area under tea in India.
- Temperature:
- 20°-30°C
- Rainfall: 150-300 cm
- Soil: deep, friable loams.
- prolonged dry spell is harmful for tea, high humidity, heavy dew and morning fog favour rapid development of young leaves.
- Although tea requires heavy rainfall for its growth, stagnant water is injurious to its roots.
- Most of the tea plantations in India are found at elevations varying from 600 to 1,800 metres above sea level.
Spices
- India is known for its spices globally because of rich aroma, taste and texture
- India is the world’s largest producer, consumer and exporter of spices
- India produces around 75 of the 109 varieties of spices listed by ISO
- Organic farming for spices is gaining great prominence in the country due to the increasing demand for safe and non-contaminated spices
- The key spices produced in the country include garlic, chili, pepper, coriander, cardamom, cumin, fennel, turmeric and ginger
Exports
- During 2016-17, a total of 9,47,790 MT of spices and spice products valued Rs.17664.61 crore (US$2633.30 Million) has been exported from the country as against 8,43,255 tons valued Rs.16238.23 crore (US$ 2482.83 Million) in 2015-16 registering an increase of 12% in volume.
- The key exports include chili, turmeric, pepper, mint products and spice oils/oleoresins.
- The key export destinations include USA, China, Vietnam, UAE and Indonesia.
Animals and Products
Fisheries/pisciculture
- Fish catch in India is of two types – marine fisheries and inland fisheries.
- India is the third largest producer of fish and second largest producer of inland fishing in the world.
- It accounts for about one per cent of the total agricultural production in India.
- About 75% of marine fish landings are on the west coast and only 25% in the east coast.
- Important fish caught along the coast are shark, sardine, herring, Mumbai duck fly fish ribbon fish and Mackerrel.
- West Bengal is the largest producer of fish in India and is the largest producer of inland fish (31%) also.
- Kerala has about 85% of India’s total processing facilities and processes the largest amount of fish in the country.
- Kerala has about 85% of India’s total processing facilities and processes the largest amount of fish in the country
- India exports about 8% of the total fish production. Sri Lanka alone purchases 80% of our fish and fish products.
- Sasson Dock in Mumbai is a major fishing harbour.
- There are six major fishing harbours and 38 minor fishing harbours. The major harbours are —Cochin, Chennai, Visakhapatnam, Roy Chowk, Paradip and Sas son dock.
- The Central Institute of Fisheries, Nautical and Engineering Training is at Kochi.
- The Central Institute of Coastal Engineering for Fisheries is in the Bengaluru.
- Livestock includes domestic animals such as cattle, buffaloes, sheep, goats, horses, ponies, donkeys, camels, pigs etc. India’s animal wealth is both large and varied. India has about 20% of the world’s livestock population.
- Dairy Farming includes a class of agricultural enterprise for long-term production of milk which is processed for eventual sale of a dairy product. India is endowed with largest livestock population in the would. It accounts for about 57.3% of the world’s buffalo population and 14.7% of the cattle population.
- Milch Breeds of Cattle — Gir, Sindhi, Red Sindhi, Sahiwal, Tharparkar and Deoni
- Draught Breeds of Cattle — Nagori, Bauchaur, Malvi Hallikar, Ponwar, Sin, Bargur.
- Dual Purpose Breeds of Cattle — Tharparkar, Haryana, Mewati, Kankrej, Rath, Nirnari, Dangi, Ongole.
- Goats Breeds — Angora, Pashmina, Barabari, Marwari, Mehsana Beetal, Kathiawani and Zaiwadi.
- Buffaloes Breeds — Murrah, Jafarabadi, Shruti, Mehsana, Nagpuri, Nu Ravi, Bhadawani.
- Horses and Ponies Breeds — Marwari, Kathiawari, Manipuri, Bhutani, Spiti and Chummarti.
Breeds
Scriculture
- Sericulture refers to the rearing of the silk worms for the raw silk production. Silk is a protein produced form the salivary gland of silk worms.
- Important features of Indian sericulture are as follows.
- It is a agro-based labour intensive, export oriented and cottage industry
- Silk is exported to more than 80 countries like USA, UK, Italy UAE, Saudi Arabia etc.
- India enjoys the unique distinction of being the only country in the world to produce all the four varieties of silk such as Mulberry Tasar, Eri and Muga.
- Muga is the monopoly of India. India ranks second in the world after China in Silk production.
Horticulture
Horticulture is a comprehensive term and indudes fruits vegetables, spices, floriculture and coconut. Some of the most important crops grown in India as a part of the horticulture sector are: mango, cashewnut, apple, banana, orange, grape, peach, pear, apricot, strawberry and vegetables. Some important information regarding these fruits is given in the table.
Fruits
Apple
Temperate fruit crop- It requires average temperature from 21oC to 4 C during the active growing season, 100-125 cm rainfall well distributed throughout the growing season. These conditions are found on the hifi slopes at altitudes arranging from 1500-2700 m above sea level.
Kullu and Shimla in Himachal Pradesh, Kashmir valley and hilly areas of Uttarakhand.
Loamy soil, rich in organic matter, free from water logging are suitable for apple cultivation.
Banana
Primarily a tropical and sub-tropical crop requiring average temperature of 20°C to 30°C throughout the growing period and rainfall fairly above 150 cm.
Tamil Nadu and Maharashtra
are the two main producers.
India is the largest producer of banana in the world.
Mango
It is native of monsoon land and is grown in areas with temperature 20°C to 30°C and rainfall 75 cm to 250cm.
Uttar Pradesh. Bihar, Andhra Pradesh, West Bengal, Odisha, Kerala, Tamil Nadu are the major producers.
India is the largest producer of
mango and contributes 54% of the
world production of mango.
Grapes
it requires long summer, short winter and moderately fertile well drained soil
The major producing States are Uttarakhand, Himachal
Pradesh. Jammu and Kashmir.
In Northern India, the plant gives only one crop during summer, but
in South India, the plant grows
throughout the year, one in March, April and the other in August and September.
Strawberry
It requires above 16 °C temperature during its growing season and lots of water because its fields are sub-merges under 10 cm of fresh and slowly moving water for at least three months.
The main producers are the hilly areas of Jammu and Kashmir, Himachal Pradesh, Uttarakhand.
Water retaining fertile soil is most
suitable.
Floriculture
Government of India has identified floriculture as a sunrise industry and accorded it 100% export oriented status. Owing to steady increase in demand of flower, floriculture has become one of the important commercial trades in agriculture.
Floriculture products mainly consist of cut flowers, pot plants, cut foilage, seeds bulbs, tubers, rooted cuttings and dried flowers or leaves. Maharashtra, Karnataka, Andhra Pradesh, Haryana, Tamil Nadu, Rajasthan, West Bengal have emerged as major floriculture centers.
UPSC_Pre_MCQ
Following are the characteristics of an area in India: [2010] 1.Hot and humid climate 2.Annual rainfall 200 cm 3.Hill slopes up to an altitude of 1100 metres 4.Annual range of temperature 15°C to 30°C. Which one among the following crops are you most likely to find in the area described above?
(a)Mustard (b)Cotton (c)Pepper (d)Virginia tobacco
Ans.(c)
The lower Gangetic plain is characterised by humid climate with high temperature throughout the year. Which one among the following pairs of crops is most suitable for this region ?[2011 – I] (a) Paddy and Cotton (b) Wheat and Jute (c) Paddy and Jute (d) Wheat and Cotton
Ans.(c)The low and deltaic plains of the Ganges is characterised by swamps and Sundarbans. So, the people out there grow Paddy and Jute.
A state in India has the following characteristics : 1. Its northern part is arid and semi-arid. 2. Its central part produces cotton. 3. Cultivation of cash crops is predominant over food crops.[2011 – I] Which one of the following states has all of the above characteristics ? (a) Andhra Pradesh.(b) Gujarat. (c) Karnataka.(d) Tamil Nadu.
Ans. (b)
.
Government Policies
Doubling Farmers’ Income (I):
Modernizing Agriculture
Strategy for New India @ 75
Source: NITI Aayog
Objectives
- Modernize agricultural technology, increase productivity, efficiency and crop diversification.
- Generate income and employment through a paradigm shift that ensures food security while maximizing value addition in agriculture.
Current Situation
The existing yield levels of a majority of crops remains much lower than the world average.
The predominant causes are low irrigation, use of low quality seeds, low adoption of improved technology, and knowledge deficit about improved agricultural practices. Close to 53 per cent of cropped area is water stressed. Rainwater management practices and services are resource starved. This limits a farmer’s capacity to undertake multiple cropping and leads to inefficient utilization of land resources.
Inefficient extension delivery systems have led to the presence of large yield gaps as well. Yield gaps exist at two levels in India. First, there is a gap between best scientific practices and best field practices. The second gap exists between best field practices and the average farmer. There exist significant yield gaps both amongst and within states. Yield gaps have been found to exist in even highly productive states such as Punjab. Closing these gaps provides an opportunity to enhance productivity and incomes significantly. This further implies that states with low productivity (or large yield gaps) have significant potential for catch-up growth in their productivity levels.
Demand side factors favour the expansion of area under fruits and vegetables, and livestock products. These enterprises also offer better income. Staple crops (cereals, pulses and oilseeds) occupy 77 per cent of the total gross cropped area (GCA) but contribute only 41 per cent to the output of the crop sector. High value crops (HVCs) contribute an almost similar amount to total output as staples do, but they occupy only 19 per cent of the GCA.1 Research has also shown that diversification to the fruits and vegetables segment is likely to benefit small and medium farmers more than large ones.
Over the past few years, new development initiatives aimed at modernising agriculture have been introduced. Pradhan Mantri Krishi Sinchai Yojana (PMKSY) aims to expand irrigation coverage whilst promoting water use efficiency. Area under micro irrigation has grown 2.5 times in the last four years. The second cycle of the Soil Health Card (SHC) scheme is underway, which will focus on job creation and entrepreneurship development through local entrepreneurship models. So far, 3.76 crore SHCs have been distributed under the second cycle.
Constraints
- Use of outdated and inappropriate technology is the main reason for low productivity of crops and livestock.
- Given the pre-dominance of small and marginal farmers in Indian agriculture, affordability becomes a significant constraint on technology adoption by farmers.
- There exist several bottlenecks hampering on-farm adoption of technology developed in public sector.
- Agricultural research in the country is constrained by resource inadequacy, regulations and intellectual property rights (IPR).
- Multiple private and public sources supplying different information to farmers create confusion.
- A huge gap exists between the demand for and supply of skills in agriculture, hindering diversification, adoption of precision agriculture and on farm post-harvest value addition.
- India has not caught up to the rest of the world in terms of technology, which has led to the dominance of inefficient production practices, such as flood irrigation, at the farm level. Renewed focus on on-ground absorption of technology, market intelligence, skills and extension and modernising trade and commerce in agriculture are needed to modernise agriculture in India.
- Both production and marketing suffer due to the absence of adequate capital.
- Low scale is a serious constraint on the adoption of improved practices and in the input and output market.
Way Forward
Productivity and efficiency
Increase area under irrigation: Irrigation coverage needs to be increased to 53 per cent of gross cropped area (GCA) by 2022-23. The focus should be on increasing coverage through microirrigation. Increase adoption of hybrid and improved seeds:
States should take the lead through the following measures:
- Dynamic seed development plans are required. These may be based on crop wise area (each season separately), seed rate per hectare used, desired/targeted seed replacement rate and crop wise seed requirement. Crop wise requirement should be worked out based on historical trends, introduction of new varieties and replacement of poor yielding varieties.
- States should aim to increase the seed replacement rate (SRR) to 33 per cent for self-pollinated crops and 50 per cent for cross-pollinated crops in alternative years.
Increase Variety Replacement Ratio (VRR): Phase out old varieties of seeds and replace them with hybrid and improved seeds to enhance productivity. The Indian Council of Agricultural Research (ICAR) along with State Agricultural Universities (SAUs) should develop climate resilient varieties of crops suitable for the 128 agro-climatic zones of the country, through farmer participatory plant breeding and adopting farm varietal trials from the third year of the development of the seed.
Strengthen seed testing facilities: Seed testing facilities need upgradation in terms of both personnel and technical expertise. Regular performance monitoring is required to maintain the quality of test results.
Uniform national procedure for seed licensing: To tackle the problem of heterogeneity in seed licensing procedures across states, the central government should develop model guidelines for seed licensing and support states in implementing these.
Efficient fertilizer usage: Strengthen the SHC scheme and include not merely nine but all sixteen parameters in the tests. This will ensure SHC based fertilizer distribution at the ground level. Seed SHCs with the integrated fertilizer management system. Link SHCs with Kisan credit cards and make SHCs mandatory for subsidies. Ensure proper functioning of the SHC labs.
Reorient fertilizer subsidy policy: The current lopsided fertilizer subsidy policy needs to bring secondary and micronutrients on the same nutrientbased subsidy (NBS) platform as phosphorus (P) and potash (K).
Regulate pesticide use: Align the pesticide regulatory framework with food safety laws to make adoption broad based. Strengthen extension activities to ensure that best practices reach the average farmer.
Custom hiring centres: Madhya Pradesh has had demonstrable success with their custom hiring centre model to hasten the pace of farm mechanization. This model should be replicated nationwide by employing rural youth and promoting entrepreneurship.
Subsidies on liquid fertilizers: Targeted subsidy should be provided on liquid fertilizers to encourage fertigation with micro-irrigation.
Investment subsidies for micro-irrigation: Rather than power and water subsidies, investment subsidies for micro-irrigation can be provided through the DBT mode.
Strengthening extension systems
Synergy between Agriculture Technology Management Agency (ATMA) and Krishi Vigyan Kendras (KVKs): The ATMA programme needs to be reoriented to include bottom up planning at the district and block levels to develop Strategic Research Extension Plans (SREP). Further decentralization and autonomy are essential to the success of this programme. Subject matter specialists at KVKs should orient their research to the block action plans developed by ATMA.
Public Private Partnership in KVKs: The guiding principles of ATMA provide for the promotion of PPP in extension delivery. With each KVK in possession of approximately 50 acres of land, KVKs should incubate private sector initiatives in extension delivery.
Market led extension: Give priority to extension services that disseminate information to farmers regarding (i) crop selection (ii) demand for and supply of crop produce, (iii) expected price of commodity and (iv) availability of infrastructure facilities for storage, transport and marketing of produce.
Value added extension: Prioritise value added extension services to enable a reduction in postharvest losses by converting raw agricultural produce to processed products. This allows for increased price realization and contributes towards increasing farmers’ income.
District level skill mapping: ICAR and SAUs should map the demand for and supply of skills in agriculture at the district level and coordinate with skill development missions to impart the required skills to farmers and agricultural labour.
Replicate dealer training programme in state agricultural universities: The National Institute of Agricultural Extension Management’s (MANAGE) dealer training programme should be replicated in SAUs, with diploma holders granted licences to conduct extension activities.
Sustainable water use in agriculture: About 83 per cent of water is used in agriculture. The solution to resolving India’s imminent water crisis lies in conserving water in agriculture. Therefore, more efficient irrigation technologies, water harvesting and better crop selection must be encouraged.
Diversification: promotion of high value crops (HVCs) and livestock
High value crops
Encourage diversification to HVCs: Design an incentive mechanism to wean farmers away from cereal crops to HVCs. The area under fruits and vegetables needs to increase by 5 per cent every year.
Establish regional production belts: As in the cluster-based approach, regional production belts for HVCs need to be identified and supported through the Mission on Integrated Development of Horticulture (MIDH). Make SHCs mandatory in these belts.
Use of hybrid technology in vegetables: Shift to using hybrid varieties for vegetables. At present, 10 per cent of the cropped area under vegetables is under hybrids. Shifting to hybrids has the potential to increase yields by 1.5 to 3 times and provide a significant increase in income.
Rootstocks for production of fruits: Rootstock technology has shown the capacity to double production and be resilient to climate stress. Measures should be taken to standardize and promote usage of rootstocks to produce fruits.
Smart horticulture: There have been pockets of success spread throughout the country, using techniques such as high-density plantation, protected cultivation and organic production. These methods need to be documented and replicated at the national level. It is recommended that a mission on smart horticulture may be setup to identify and promote new technologies. This mission must work in synergy with various agricultural research institutions in the country.
Strengthen market for organic products: Targeted efforts to create a market for niche products is recommended. Spices unique to a state can be branded by the Spice Board to encourage the production of organic spices.
Convert agricultural waste: Recycling and utilizing agricultural waste would give a further filip to farmers’ income.
Livestock and fisheries
Breed indigenous cattle with exotic breeds: Breeding of indigenous cattle with exotic breeds needs to be encouraged to arrest the issue of inbreeding. This will enable greater gene coverage, reduced diseases and greater resilience to climate change.
Promote and develop bull mother farms: Employing multiple ovulation and embryo transfer technologies, these farms can significantly enhance milk productivity through the supply of cattle with enhanced milk potential to farmers.
Village level procurement systems: Installing of bulk milk chillers and facilities for high value conversion of milk are needed to promote dairy in states. The private sector should be incentivized to create a value chain for HVCs and dairy products at the village level.
Convergence of schemes in fisheries sector: Integrate the Blue Revolution scheme with MGNREGA. Ponds created through MGNREGA should be used to promote aquaculture and can be used to create potential clusters as well.
Capacity building for fish breeders and farmers: Establish fish co-operative organisations and run village level schemes in coordination with panchayats to disseminate best practices and research.
………………..
Doubling Farmers’ Income (II):
Policy & Governance
Strategy for New India @ 75
Source: NITI Aayog
Objectives
- Create a policy environment that enables income security for farmers, whilst maintaining India’s food security.
- Encourage the participation of the private sector in agricultural development to transition from agriculture to robust agri-business systems.
- Promote through government policies the emergence of ‘agripreneurs’ so that even small and marginal farmers can capture a higher share of value addition from ‘farmgate to fork’.
Current Situation
The mismatch between the contribution of agriculture to national income and share in employment has remained large and has widened. The manufacturing and service sectors have failed to absorb the excessive workforce in agriculture. Consequently, value addition per worker in agriculture grew slowly and income per farmer never crossed one-third of the income of a non-agriculture worker since the 1980s. The country took 22 years to double farmers’ income at an annual growth rate of 3.31 per cent during 1993-1994 to 2015-16; doubling farmers’ income between 2015-16 and 2022-23 will require an annual growth rate of 10.4 per cent in farmers’ real income.
Corporate investment in agricultural infrastructure has not exceeded 2 per cent. In the years post-independence, the policy structure was focused on increased production and productivity to ensure food security for India. However, to achieve the target of doubling farmers’ income by 2022-23, we need to shift our focus from agriculture to agri-business.
The current government has taken several steps to improve private investment in agriculture. 100 per cent foreign direct investment (FDI) was allowed in 2016-17. Similarly, the SAMPADA scheme targets creation of food processing infrastructure. The budget allocation to the food processing sector was doubled in the Union Budget 2018-19. Introduction of the Model Agricultural Produce and Livestock Marketing Act (2017), Model Contract Farming Act, new guidelines for agro-forestry are some other key policy initiatives taken over the past few years.
Constraints
Fragmented land holdings
Agriculture is characterised by an extremely fragmented landholding structure with an average farm size of 1.15 hectares and the predominance of small and marginal farmers, with those holding less than 2 hectares (accounting for 85 per cent of agricultural households).1 This makes it difficult for them to access credit or new technology, severely affecting farm productivity and hence, farmers’ incomes.
Low price realization
There exists a large gap between farm harvest prices (FHP) and retail prices . Prices also tend to fall below the minimum support prices in a good production year, leading to agrarian distress. Mechanisms need to be developed to ensure remunerative prices to farmers, in both ‘good’ and ‘bad’ monsoon years.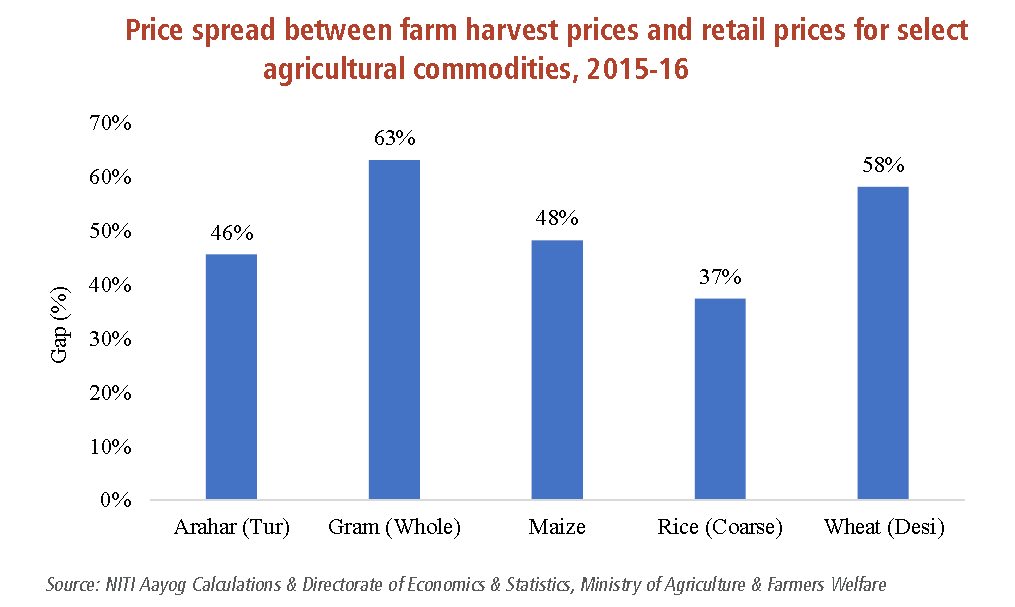
Non-farm employment
Lack of non-farm employment opportunities has resulted in excessive dependence on agriculture for livelihood among both small and marginal farmers as well as among the landless.
Agricultural credit
Despite an allocation of more than INR 11 lakh crore of commercial credit, access to institutional credit remains a constraint, especially in the case of tenant farmers.
Agricultural trade
Exporters of agro-commodities are not successful in raising their share in global markets because of uncertainty in the foreign trading regime.
Way Forward
Marketing reforms
Many of the constraints in marketing can be addressed by adopting the Model Agricultural Produce and Livestock Marketing Act (APLM), 2017,3 which provides for progressive agricul-tural marketing reforms, including the setting up of markets in the private sector, allowing direct sales to exporters/processors and cus-tomers, farmer-consumer markets, e-trading, single point levy of market fee, a unified single trading licence in a state, declaring warehouses/ silos/cold storage as market sub-yards and the launch of the National Market for Agriculture. APLM should be adopted by all states as expe-ditiously as possible.
Amend Essential Commodities Act
The Essential Commodities Act, which has proven a disincentive to large investment in agricultural technology and infrastructure, should be replaced with a modern statute that balances the interests of farmers and consumers.
Stable export policy
In consultation with all stakeholders, the Government of India should come up with a coherent and stable agricultural export policy, ideally with a five to ten-year time horizon and a built-in provision for a mid-term review. Efforts should be made to achieve this urgently.
Price realization
The government should consider replacing the Commission on Agricultural Costs & Prices (CACP) by an agriculture tribunal in line with the provisions of Article 323 B of the Constitution. NITI Aayog should set up a group to examine the following:
- Replacing the minimum support price (MSP) by a minimum reserve price (MRP), which could be the starting point for auctions at mandis.
- Separating the criteria for MSPs for (i) surplus produce; (ii) for deficit but globally available products; and (iii) for products that are in deficit both domestically and globally.
- Examine options for including private traders operating in markets to complement the minimum support price regime through a system of incentives and commission payments.
Raising MSP or prices can only be a partial solution to the problem of assuring remunerative returns to farmers. A long-term solution lies in the creation of a competitive, stable and unified national market to enable better price discovery, and a long-term trade regime favourable to exports.
Agriculture advisory service: An effective and technology driven Agriculture Advisory Service may be considered on the lines of those of the United States Department of Agriculture (USDA) and the European Union (EU). The mandate would be to ensure that farmers adopt an optimal cropping pattern that maximizes their income.
Futures trade: Futures trade should be encouraged. Removal of entry barriers to increase market depth should be considered.
Crop insurance: PMFBY needs to be modified to –
- Promote weather-based insurance.
- Increase non-loanee farmers’ insurance coverage.
- Allow for mixed cropping and increase the number of crops notified.
Contract farming
Encourage states to adopt the Model Contract Farming Act, 2018: Contract farming can be thought of as a form of price futures. The contract will specify the price and quality at which the farmers’ produce will be purchased. This protects the farmer in cases where prices fall below the MSP.
Box 1: Salient features of the Model Contract Farming Act, 2018
The Draft Model Contract Farming Act, 2018, is an attempt to provide an enabling environment for contract farming to thrive. First, the Act takes contract farming out of the ambit of Agricultural Produce Marketing Committees (APMCs).
Under the Model Act, every agreement shall be registered with a Registering and Agreement Recording Committee, consisting of officials from departments such as agriculture, horticulture, animal husbandry, marketing, fisheries and rural development. The committee can be set up at the district, block or taluk levels. The Act also contains a provision for the creation of a State-level Contract Farming (Promotion and Facilitation) Authority.
Dispute resolution is essential to the smooth functioning of the Model Act. Both farmers and buyers need to be protected from risks pertaining to executing the contract. For example, buyers are exposed to the risk
of the farmer selling his produce to a third party, whilst the farmer is exposed to the risk of receiving a price below the agreed price. The Model Act contains several provisions for dispute resolution. Briefly, these are (i) negotiation and reconciliation for a mutually acceptable solution, (ii) referral of the matter to a nominated dispute settlement officer and (iii) appealing to the Contract Farming (Promotion and Facilitation) Authority if no suitable solution is found through solutions (i) and (ii).
Land Aggregation
Encourage states to adopt the Model Agri-culture Land Leasing Act, 2016: The Model Act aims to improve land access to small and marginal farmers through land leasing, whilst also providing for a mechanism for tenants to avail of institutional credit. A major constraint to land leasing under the present regulatory environment is the un-willingness of landowners to lease out land due to fears of land capture by tenants. The Model Act spells out the rights and responsibilities of both landowners and tenants. Like the Model Contract Farming Act, 2018, this Act too contains provisions for dispute resolution within a specified timeframe.
Digitize land records: Complete digitiza-tion of land records is a must for effective implementation of land leasing. Geo-tag-ging, along with location agnostic online registration of land records to generate updated land records, must be carried out.4
Promote farmer producer organizations (FPOs): There are now 741 FPOs in the country, managed under the aegis of Small Farmers Agribusiness Consortium (SFAC). They have demonstrated that aggregating farmers can help achieve economies of scale. The benefits accord-ed to start-ups under the Start-up India Mission need to be extended to FPOs as well. National Bank for Agriculture and Rural Development (NABARD’s) model of joint liability groups can be promoted to channelize small growers into the value chain.
Research & development
Focus on precision agriculture: Support research on energy friendly irrigation pumps, micro irrigation, climate smart technologies, internet of things (IoT), and use of technology in animal husbandry to monitor animal behaviour, health and production to prepare for future challenges.
Raise research spending: Research spending, currently at 0.3 per cent, needs to be increased to at least 1 per cent of agricultural GDP.
Create a knowledge hub to disseminate best practices: It is essential that new technology be adopted at the farm level. The performance of Krishi Vigyan Kendras (KVKs) should be regularly reviewed by external agencies and well performing KVKs must be strengthened to disseminate best practices at the field level.
Develop models of integrated farming: Research so far has focused on practices for individual crops or enterprises. The
Indian Council of Agricultural Research (ICAR) and State Agriculture Universities (SAUs) should focus on providing recommendations across the farming value chain, covering production, post-production, processing and other value-addition activities.
Innovation
Several breakthroughs have the clear potential for quickly doubling farmers’ income.
- One is the recorded success of zero budget natural farming by Subhash Palekar. It is now being adopted across the country and providing notable increases in farmers’ net income by sharply reducing costs of production and improving incomes by raising yields and improving the quality of agricultural produce.
- Two, there are patented herbal inputs that improve soil quality and make plants more pest resistant. These herbal inputs, for which actual performance data is now available for a few thousand farmers, need to be applied across the country.
- Three, rapid progress has also been made in organic farming techniques, which have also helped improve incomes of cultivators and dairy farmers. These should be carefully examined for possible application across the country.
Non-farm income
- Moving labour out of agriculture into manufacturing will go a long way towards the goal of doubling farmers’ income.
- According to estimates prepared by Chand, Srivastava & Singh (2017), nearly two-thirds of rural income is generated in non-agricultural activities. In non-agricultural activities in rural areas, another avenue is shifting farmers to agro-business and farm-related skills which are currently in short supply. Create and nurture agripreneurs for achieving greater value addition through agro-processing and propagation of modern extension services.
- India will also have to accelerate growth in the manufacturing, services and exports sectors to wean labour away from agriculture. This will result in higher productivity and income for farmers.
…………………………………………..
Doubling Farmers’ Income (III):
Value Chain & Rural Infrastructure
Strategy for New India @ 75
Source: NITI Aayog
Objectives
- Transform the rural economy through the creation of modern rural infrastructure and an integrated value chain system.
- Leverage the value chain to boost India’s exports of food products.
- Create occupational diversification and quality employment opportunities for doubling farmers’ income by 2022-23.
Current Situation
Despite rapid progress, rural India suffers from an infrastructure deficit. The present government has done an admirable job in achieving full village electrification and accelerating the pace of connecting habitations through the Pradhan Mantri Gram Sadak Yojana (PMGSY). Similarly, household electrification has been given a significant push under the Saubhagya scheme. Agriculture infrastructure, such as rural markets, warehouses, cold chain, farm machinery hubs and public irrigation need upgradation.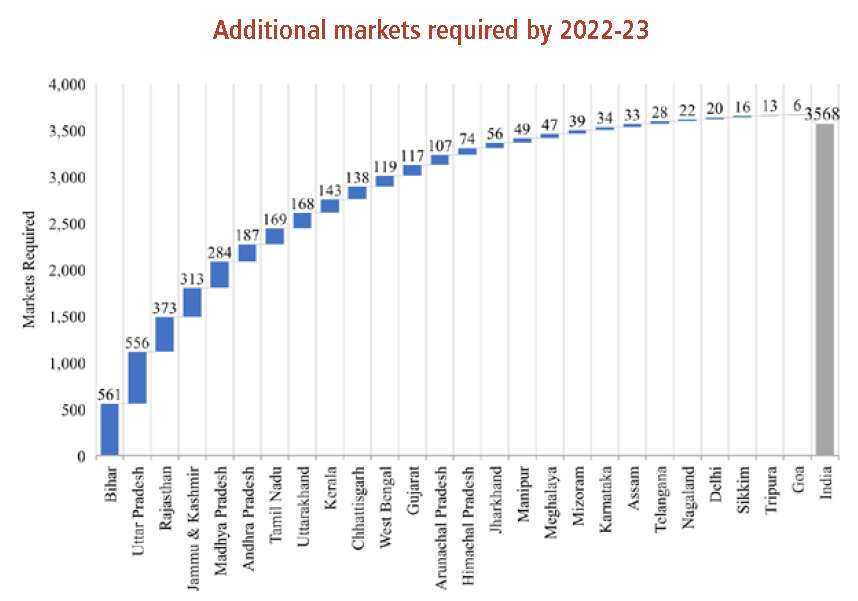
Gaps in cold-chain development
|
Type |
All-India Requirement 2015 |
Status on 31.12.2017 |
|
Pack-houses |
69,831 |
20,864 |
|
Cold Storage (million) |
34.16 MT |
35.88 MT |
|
Reefer Vehicles |
52,826 |
1,047 |
|
Ripening Chambers |
8,319 |
443 |
Source: National Centre for Cold Chain Development (2015)
Based on the recommendations of the Dalwai Committee on Doubling Farmers’ Income, the number of additional markets required comes to 3,548. The recent 2018-19 budget announcement to develop the existing 22,000 Rural Periodic Markets (RPMs) into Grameen Agriculture Markets (GrAMs) will offer better market access to small and marginal farmers. This initiative recognises GrAMs as facilities for first stage post production activities, enabling aggregation and transport from the village level to wholesale markets. The electronic national agriculture market (e-NAM) was launched in 2016 to create a unified national market. So far, 479 mandis across 14 states and UTs have been integrated on the platform.
The lack of an adequate and efficient cold chain infrastructure leads to massive post-harvest losses, estimated at INR 92,561crore annually.1 Perishables account for the bulk of post-harvest losses. Moreover, as a recent report indicates,2 most existing cold storages are single commodity storages, resulting in their capacities lying idle for up to six months a year. The cold-chain infrastructure is also unevenly distributed among states.
Inadequate cold-chain infrastructure hampers India’s food exports as well. Countries across the world have stringent guidelines for import of agricultural and processed food products.
The European Union (EU) has raised more notifications, issued more rejections and destroyed more consignments from India as compared to consignments from other developing countries such as Turkey, Brazil, China and Vietnam.3 India has huge export potential, reflected in the fact that its domestic commodity prices were below export parity prices in 72 per cent of cases.4
The present government has taken several steps to modernise the agri value chain. The SAMPADA central sector scheme aims to supplement agriculture by modernising processing activities and decreasing agri-waste. Similarly, in the 2018-19 budget, ‘Operation Green’ on the lines of ‘Operation Flood’ was announced. This scheme aims to promote farmer producer organisations, agri-logistics, processing facilities and professional management of such operations.
Constraints
- Public and private investments in agriculture have remained low since the early 90s. Bottlenecks in implementation and a high degree of uncertainty have further reduced investor appetite for agricultural investments.
- Inability to acquire land for setting up of market yards, resulting from the restrictions on land leasing and land acquisition, is another major constraint.
- Even the existing marketing infrastructure suffers because of a lack of finances, manpower and proper facilities. Sub-market yards largely function as a location for government procurement and do not provide opportunities for open auction. Further, they are irregular in their operations and handle less than five per cent of the volume handled in principal yards.
- Poor maintenance of rural roads is a major constraint as well. Linkages with local and feeder roads remain sub-optimal.
- In the electricity sector, separate feeders for supply of power to agriculture and domestic electrification have not been carried out in many states.
- Lack of agriculture best practices hinders India’s food exports. Interventions at the farm or producer level are needed to ensure that products meet export standards. However, factors such as the lack of a traceability mechanism from the farm to the consumer, fragmented holdings and restrictions on direct procurement of products from farmers in some states makes it virtually impossible to ensure that products meet export quality standards.
Way Forward
Markets and value chain
Infrastructure status for agriculture value chains: Warehousing, pack-houses, ripening chambers, and cold storages, including those set up at the village level, should be accorded full-fledged infrastructure status to enable them to avail of the fiscal benefits that come with infrastructure status.
Village level procurement centres: To benefit small and marginal farmers, government collection centres and warehousing facilities should be
set up at the village/block level. The budget announcement of developing Gramin Agricultural Markets (GrAMs) will help develop the agricultural marketing infrastructure and bring markets closer to the farm-gate.
Link production to processing: Village level collection centres for fruits and vegetables should be linked to larger processing units. Actively engage the private sector in developing processing centres near rural periodic markets (RPMs).
Food processing: A greater focus should be placed on the food processing industry for enhancing value addition in vegetable and fruit crops. The government has now shifted its attention to promoting “agripreneurs”. This will result in rapid modernization of the agriculture sector.
Rural markets: Develop private market yards. Agro-processors and food processors that wish to establish backward integration to secure their raw material should partner with the government in organizing sourcing through the RPMs.
Upgrade wholesale markets: Upgrade wholesale markets with facilities for temporary storage, pack-house operations and cold storage facilities.
Warehouse upgradation: Pledge financing at warehouses, through negotiable warehouse receipts (NWR), needs to be adopted and popularized as an alternative means of financing. The Department of Agriculture and Farmers’ Welfare (DACFW) should draw up guidelines to promote warehouse based post-harvest loans and e-NWR trading.
Block level resource centres: Establish functional block level resource centres to create value chains, targeting clusters of villages along with social services. It will create an integrated solution for the farmer to access his/her requirements for agriculture and other services. It will also add to employment generation at the local level by engaging youth and creating village level entrepreneurs.
Convergence in government initiatives: Coordination is needed between the initiatives of the Ministry
of Agriculture, Food Processing, and Commerce to develop effective procurement linkages, processing facilities, retail chains and export activity. This will facilitate synergies between various initiatives such as the Rashtriya Krishi Vikas Yojana (RKVY) of the agriculture ministry, viability gap funding of the Ministry of Commerce for cold chains and warehousing infrastructure development and Pradhan Mantri Kisan Sampada Yojana of MOFPI.
Strengthen railway freight operations: Railway freight operations should be strengthened through temperature-controlled containers and loading and unloading facilities to reduce post-harvest losses and connect land-locked states to export markets.
Rural roads, electricity and mechanization
Maintenance of rural roads through women SHGs: The maintenance of roads by women SHGs has been experimented with by some states (Uttarakhand for example) and has been found to be very promising. This model could be replicated by other states.
Revisit criteria for identification of rural habitats for road connectivity: To ensure better inclusion, the criteria for identification of habitats for rural roads connectivity in hill and left-wing extremism (LWE) affected districts must be revisited.
Incentivize feeder separation: All distribution companies (DISCOMs) need to be incentivized for rural feeder separation. Agriculture connections and electricity supply feeders should be separated from domestic rural electricity supply.
Incentivize private investment in farm implements: Private entrepreneurs should be incentivized to establish small farm implement mechanization hubs for every 1000 ha and big machinery hubs for every 5000 ha of cultivated area.
Export enablers
Develop export oriented clusters: The Agricultural and Processed Food Export Development Authority (APEDA) has been championing the development of export-oriented clusters with common infrastructure facilities. These clusters should contain a functional, end-to-end cold chain system along with processing facilities.
Increase the number of testing laboratories: There exists a shortage of testing laboratories, essential for health certificates for exports. Private laboratories should be extended financial support to achieve international accreditation. As suggested by APEDA, agricultural universities should also seek to get their labs accredited by APEDA.
Augment cargo handling facilities at airports: APEDA has suggested augmenting the capacity of the Ahmedabad Air Cargo Complex and Mumbai Airport to handle agricultural cargo.
Green channel clearance: Efforts must be made to setup a green channel for perishable produce at identified airports handling cargo.
Regulatory frameworks to combat rejections in export markets: Regulatory frameworks regarding use of pesticides, growth hormones, and antibiotics for marine produce need to be developed and implemented effectively to curb the rejection rate in the export market.
Ensure traceability mechanism: Promotion of farmer producer organizations (FPOs), export-based clusters and contract farming will go a long way towards ensuring traceability of farm produce, a key export requirement.
………………………….
Major Programmes
Source: India 2017,
Ministry of Information & Broadcasting.
National Policy for Farmers
Government of India approved the National Policy for Farmers (NPF) in 2007. The Policy provisions, inter alia, include asset reforms in respect of land, water, livestock, fisheries, and bio-resources; support services and inputs like application of frontier technologies; agricultural biosecurity systems; supply of good quality seeds and diseasefree planting material, improving soil fertility and health, integrated pest management systems; support services for women like creches, child care centres, nutrition, health and training; timely, adequate, and easy reach of institutional credit at reasonable interest rates, and farmer-friendly insurance instruments; use of Information and Communication Technology (ICT) and setting up of farmers’ schools to revitalize agricultural extension; effective implementation of MSP across the country, development of agricultural market infrastructure, and rural non-farm employment initiatives for farm households; integrated approach for rural energy, etc. Many of the provisions of the NPF are being operationalised through various schemes and programmes which are being implemented by different central government departments and ministries. For the operationalisation of the remaining provisions of the Policy, an Action Plan has been finalized and circulated to the ministries and department concerned, as well as to all states and UTs for necessary follow up action. An inter-ministerial committee has also been constituted to monitor the progress of the Plan of Action for the operationalisation of the NPF.
Pradhan Mantri Krishi Sinchayee Yojana (PMKSY):
The Scheme has been approved with an outlay of 50,000 crore for a period of 5 years (2015-16 to 2019-20). The major objective of PMKSY is to achieve convergence of investments in irrigation at the field level, expand cultivable area under irrigation, improve on-farm water use efficiency to reduce wastage of water, enhance the adoption of precision irrigation and other water saving technologies (more crop per drop), enhance recharge of aquifers and introduce sustainable water conservation practices, etc. A sum of 5,300 crore, comprising 1,800 crore for Department of Agriculture & Cooperation, 1,500 crore for Department of Land Resources and 2,000 crore for Ministry of Water Resources, River Development & Ganga Rejuvenation has been provisioned in BE 2015-16.
Agricultural Credit
Government announces annual target for agriculture credit in the budget every year. Agricultural credit flow has shown consistent progress every year.
Agricultural credit of 7,11,621 crore was provided to the farmers against target of 7,00,000 crore in 2013-14. In the year 2014-15, agricultural credit flow was 8,45,328.23 crore against the target of 8,00,000 crore.
Target for the year 2015-16 was fixed at 8,50,000 crore and the achievement was 6,30,243.87 crore upto December 31, 2015.
Kisan Credit Card
The Kisan Credit Card Scheme is in operation throughout the country and is implemented by Commercial Banks, Cooperative Banks and Regional Rural Banks. The Scheme has facilitated in augmenting credit flow
for agricultural activities. The scope of the KCC has been broad-based to include term credit and consumption needs.
The KCC Scheme has since been simplified and converted into ATM enabled debit card with, inter alia, facilities of one-time documentation, built-in cost escalation in the limit, any number of drawals within the limit, etc., which eliminates the need for disbursement through camps and mitigates the vulnerability of farmers to middlemen.
Crop Insurance
In order to protect farmers against crop failure due to natural calamities, pests and diseases, weather conditions, Government of India had introduced the National Crop Insurance Programme (NCIP) with component schemes of Modified National Agricultural Scheme (MNAIS), Weather Based Crop Insurance Scheme (WBCIS) and Coconut Palm Insurance Scheme (CPIS). In addition, National Agricultural
Insurance Scheme (NAIS) which was to be withdrawn after implementation of NCIP from Rabi 2013-14 has been extended further up to 2015-16.
The existing crop insurance schemes have recently been reviewed in consultation with various stakeholders
including states/ UTs. As a result of the review, a new scheme Pradhan Mantri Fasal Bima Yojana (PMFBY) has been approved for implementation from kharif 2016 along with pilot Unified Package Insurance Scheme (UPIS) and restructured Weather Based Crop Insurance Scheme (WBCIS). Under the PMFBY, a uniform maximum premium of only 2 per cent will be paid by farmers for all kharif crops and 1.5 per cent for all Rabi crops. In case of annual commercial and horticultural crops, the maximum premium to be paid by farmers will be only 5 per cent. The premium rates to be paid by farmers are very low and balance premium will be paid by the Government to provide full insured amount to the farmers against crop loss on account of natural calamities.
Special Rehabilitation Package for Distressed Farmers
(i) A Special Rehabilitation Package for 31 suicide prone districts in the four states, namely, Andhra Pradesh, Maharashtra, Karnataka and Kerala was implemented.
Against the approved outlay of 16978.78 crore, 19,998.70 crore was sanctioned/released under the package to these states. The package has stabilized the conditions of the farmers in the identified districts.
(ii) As part of Special Rehabilitation Package meant for suicide districts, two packages were approved by the Government of India for Kerala based on the various programmes/interventions suggested by the M.S. Swaminathan Research Foundation in 2008:
(a) development of Kuanad Wetland Ecosystem with financial outlay of 1,840.75 crore and
(b) mitigation of Agrarian Distress in Idukki district with financial outlay of 764.65 crore.
The Government of Kerala has been advised to implement sanctioned projects under the ongoing schemes and also to continue the activities for improving the conditions of farmers by taking various initiatives under Rashtriya Krishi Vikas Yojana and other schemes/programmes in order to sustain the gains achieved under these packages.
Commission for Agricultural Costs and Prices:
Commission for Agricultural Costs and Prices (CACP), set up with a view to evolving a balanced and integrated price structure, is mandated to advise on the price policy (MSP) of 23 crops. These include seven cereal crops (paddy, wheat, jowar, bajra, maize, ragi and barley), five pulse crops (gram, tur, moong, urad and lentil), seven oilseeds (groundnut, sunflower seed, soyabean, rapeseed—mustard, safflower, niger seed and sesamum), copra (dried coconut), coon, raw jute and sugarcane fair and remunerative prices (FRP) instead of MSPÀ. While recommending MSPs/FRP, CACP is called upon to ensure that the production patterns are broadly in line with the overall needs (demand) of the economy. CACP submits its recommendations to the government in the form of price policy reports every year, separately for five groups of commodities namely kharif crops, rabi crops, sugarcane, raw jute and copra. Before preparing these five pricing policy reports, the Commission seeks views of various state governments, concerned national organizations and ministries.
Determinants of MSP:
While recommending price policy of various commodities under its mandate, the Commission keeps in mind demand and supply, cost of production, price trends in the market, both domestic and international, intercrop price parity, terms of trade between agricultural and non-agricultural sectors, likely implications of MSP on consumers of that product, besides ensuring optimal utilization of natural resources like land and water. It may be noted that cost of production is an important factor that goes as an input in determination of MSP but it is not the only factor. Thus, recommending MSPs of various crops is not a ‘cost plus’ pricing exercise, though cost is an important determinant.
Indian Council of Agricultural Research
Agricultural research and education in India is spearheaded by the Indian Council of Agricultural Research (ICAR), an autonomous organization under the Department of Agricultural Research and Education DARE), Ministry of Agriculture and Farmers’ Welfare, Government of India.
This apex body is mandated for coordinating, guiding and managing research and education in agriculture and allied activities. It has the largest network of agricultural research and education in the world with 109 institutes, 78 all India coordinated projects/networks, 642 Krishi Vigyan Kendras (KVKs), 71 state agricultural/veterinary/horticultural/fishery universities and four general universities with agricultural faculty spread across the country.
Keeping pace with the changing requirements of country’s farm sector, ICAR Institutes developed a number of cost-effective technologies, techniques and products, not only to enhance the productivity of various crops and commodities, but also the quality of produce, for enabling remunerative agriculture.
Soil and Water Productivity
Land resource inventory on 1:10,000 scale was prepared taking Landscape Ecological Unit (LEU) consisting of landforms, land use and slope as the base map while bioclimatic map of India was revised. Electronic atlas of water resources developed for Odisha and Himachal Pradesh, is a useful tool for catch assessment and developing GIS based decision support system.
Climate Change
The Cool Farm Tool model used to estimate emission of GHGs, integrates several globally determined empirical GHG quantification models. Using the tool, GHG fluxes (carbon-dioxide and methane), moisture and heat in the soilplant- atmosphere systems were measured in rice-wheat rotation. Among the cropping systems, maize-wheat cropping registered highest carbon management index. The cumulative seasonal methane emission was reduced by 75 per cent in aerobic rice as compared to continuously flooded rice and the seasonal emissions were lower in slow-release N fertilizer.
Livestock Improvement
India has been holding the position of leading milk producing nation in the world for the last several years with sustainable increase in the annual milk production wherein the research developments played a crucial role. Studies showed that average first lactation 305 day milk yield of cows was 3,703.6±31.3 kg and average age at first calving was 1,036.6±10.2 days. Under Conservation and Genetic Improvement of Indigenous Cattle Breeds, the milk yield showed an increasing trend among the progenies of different
sets, and average 305 day milk yield increased from 1,958 kg in first set to 2,604 kg in 10th set. Semen doses of Gir, Kankrej, Sahiwal were produced and utilized for insemination. Cloning of the only alive wild-buffalo of Chhattisgarh has opened up new avenues of cloning technology application in conservation of endangered species. Prolific sheep strain GMM × P (Garole-Malpura-Malpura -Patanwadi) revealed a multiple birth of 50 per cent.
Agricultural Education
For maintaining and upgrading quality and relevance of higher agricultural education, financial and monitoring support was provided for Niche Area of Excellence (28), Experiential Learning Units (21 new), besides refurbishing and maintenance of educational structures, student and faculty amenities, course curricula revision/improvement, strengthening of libraries with ICT and modernization of teaching with multimedia learning resources. HRD programmes/ activities facilitated promotion and execution of ICAR sponsored schemes that include centralized admissions in UG/PG to reduce inbreeding, infuse merit and
promote national integration; award and distribution of fellowships to attract talent and promote merit, admission of foreign students for globalization of agriculture education, capacity building of faculty through summer-winter schools and Centre of Advanced Faculty training, National Professorial Chairs and National Fellow Scheme for promotion of excellence, Emeritus Scientist Scheme as a structural method of utilizing skill bank of the outstanding superannuated professionals.
Technology Assessment
The processes of technology assessment and refinement are as important as the technology generation prior to transfer at the field level. During the reported period, 2,652 technology interventions were assessed across 4,003 locations by laying out 27,008 trials on the farmers’ fields. Women specific income generation technologies (205) related to technological empowerment of rural women were assessed at 394 locations covering 2,917 trials under the thematic areas. Technological interventions (39) in 43 locations were refined through 398 trials on livestock, poultry and fisheries under the thematic areas, viz., disease management, feed and fodder management, nutrition management and production and management. In all, 228.75 lakh quality planting materials of elite species of different crops were produced and provided to 18.38 lakh farmers. Bio-agents, biopesticides, bio-fertilizers, vermi-compost, mineral mixture, etc. were produced and supplied to the extent of 16,406 quintal benefiting 9.39 lakh farmers. Kisan Mobile Advisory (KMA), an initiative by the ICAR, sent 93,949 short text messages, 14,788 voice messages and 1,180 both
SMS and voice messages to benefit 223.94 lakh farmers on various aspects of agriculture based on input provided by 557 KVKs.
National Agricultural Science Fund
The National Agricultural Science Fund (NASF), established to support basic and strategic research in agriculture, beside supporting, reviewing, monitoring and evaluation of the ongoing projects also initiated funding of new projects which were in the process of evaluation.
- During the year 2015-16, the NASF delivered five patents and 38 technologies. Some of the important projects are:
- Phenomics of moisture deficit and low temperature in rice double herbicide tolerant transgenic rice for weed management;
- Development of transgenic pigeon pea and chickpea;
- Dominant nuclear male sterility system in rice for hybrid seed production;
- Development of genetically engineered vaccines against poultry viral disease;
- Adaptive mechanism and capture breeding in hilsa;
- Green fishing systems for the tropical seas, defence genes of tiger shrimp against bacteria and white spot syndrome virus besides several others.
Animal Husbandry, Dairying and Fisheries
The Department of Animal Husbandry, Dairying and Fisheries is one of the departments under the Ministry of Agriculture. The department is responsible for matters relating to livestock production, preservation, protection and improvement of stocks, dairy development, matters relating to the Delhi Milk Scheme and the National Dairy Development Board. It also looks after all matters pertaining to fisheries, which includes inland and marine sectors and matters related to the National Fisheries Development Board.
Functions
The Department advises the state governments and union territories in the formulation of policies and programmes in the field of animal husbandry, dairy development and fisheries. The main focus of the activities is on :
(a) development of requisite infrastructure in states/union territories for improving animal productivity;
(b) promoting infrastructure for handling, processing and marketing of milk and milk products;
(c) preservation and protection of livestock through provision of health care;
(d) strengthening of central livestock farms (cattle, sheep and poultry) for development of superior germplasm for distribution to states; and
(e) expansion of aquaculture in fresh and brackish water, development of marine fisheries infrastructure and post harvest operations and welfare of fisherfolk, etc.
Animal husbandry, dairying and fisheries activities play an important role in national economy and in socioeconomic development of the country. These activities have contributed to the food basket, nutrition security, and household income of the farmers and play a significant role in generating gainful employment in the rural areas, particularly among the landless, small and marginal farmers and women, besides providing cheap and nutritious food.
Livestock are the best insurance for farmers against vagaries of nature like drought and other natural calamities.
Population of Livestock
Livestock census started in the country in the year 1919. So far 19 such censuses have been conducted. It is a complete count of the livestock and poultry at a pre-defined reference date. The livestock species namely cattle, buffaloes, sheep, goats, pigs, horses and ponies, mules, donkeys, camels, mithuns and yaks are covered in the census. The other species covered are dogs, rabbits and elephants. In the census, head count is done for each of these species and recorded in their respective households/household enterprises/non-household enterprises and other institutions. The species-wise population of livestock and poultry in previous two censuses are given in the table here:
Livestock population (2019 Livestock census)
|
SN |
Species |
Number |
Ranking in the world population |
|
01 |
Cattle |
192.49 |
Second |
|
02 |
Buffaloes |
109.85 |
First |
|
Total |
302.79 |
First |
|
|
03 |
Sheep |
74.26 |
Third |
|
04 |
Goats |
148.88 |
Second |
|
05 |
Pigs |
9.06 |
– |
|
06 |
Others |
0.91 |
– |
|
|
Total livestock |
535.78 |
|
|
|
Total poultry |
851.81 |
Seventh |
|
07 |
Duck |
– |
Fifth |
|
08 |
Chicken |
– |
|
|
09 |
Camel |
0.25 |
Tenth |
Source: Annual Report 2018-19, Department of Animal Husbandry, Dairying and Fisheries, Ministry of Agriculture and Farmers Welfare, Govt. of India.
Estimates of Major Livestock Products
The estimation of major livestock products such as milk, egg, meat and wool are based on the results of Integrated Sample Survey. The survey is done on 15 per cent sample of villages every year covering 5 per cent each in every season (summer, rainy and winter). The survey period in the entire year is March to February.
Production of livestock in India 2017-18
|
SN |
Product |
Qty |
Ranking world production |
|
01 |
MILK in MT |
176.30 |
FIRST |
|
02 |
EGGS in millions |
95,217 |
THIRD |
|
03 |
MEAT MT |
7.70 |
NA |
|
04 |
WOOL in m kgs. |
41.50 |
NA |
|
05 |
FISH in MMT |
12.61 |
SECOND |
Source: Annual Report 2018-19, Department of Animal Husbandry, Dairying and Fisheries, Ministry of Agriculture and Farmers Welfare, Govt. of India.
Dairy Development
Demand of milk in the country is expected to reach upto 150 million tonnes by the end of year 2016-17 and upto 210 million tonnes by 2021-22. The dairy sector has grown substantially over the years. As a result of prudent policy intervention, India ranks first among the world’s milk producing nations, achieving an annual output of 145 million tonnes (Provisional) during the year 2014-15 as compared to 137.68 million tonnes during 2013-14 recording a growth of 5.32 per cent. The anticipated milk production in the country for the year 2015-16 is about 148 million tonnes.
This represents a sustained growth in the availability of milk and milk products for growing population.
Dairying has become an important secondary source of income for millions of rural families and has assumed the most important role in providing employment and incomegenerating opportunities particularly for women and marginal farmers. The per capita availability of milk was at a level of 302 grams per day during the year 2013-14, which was more than the world average of 294 grams per day. Most of the milk in the country is produced by small, marginal farmers and landless labours. About 15.46 million farmers have been brought under the ambit of 1,62,186 village level dairy corporative societies upto March 2014.
The cooperative milk unions procured an average of 39.2 million kg of milk per day during the year 2014-15 as compared to 34.2 million kg in the previous year recording a growth of 12.5 per cent. The sale of liquid milk by cooperative sector has reached 29.9 million litres per day during the year 2014-15 as compared to 28 million tonnes registering a growth of 6.8 per cent over the previous year.
The efforts of the Department in the dairy sector are concentrated on promotion of dairy activities including nonoperation flood areas with emphasis on building up cooperative infrastructure, revitalization of sick dairy
cooperative milk unions and creation of infrastructure in the states for production of quality milk and milk products. The National Dairy Development Board (NDDB) continues its activities for overall development of the sector in Operation Flood areas.
National Programme for Bovine Breeding and Dairy Development
A new restructured scheme namely, National Programme for Bovine Breeding and Dairy Development (NPBBDD), was launched in 2014 by merging three Dairy Development schemes of Intensive Dairy Development Programme (IDDP), Strengthening Infrastructure for Quality and Clean Milk Production (SIQ and CMP) and Assistance to Cooperative (A to C) and National Programme for Cattle and Buffalo Breeding. The Scheme has two components:
(a) National Programme for Bovine Breeding (NPBB);
(b) National Programme for Dairy Development (NPDD).
The NPBB will focus on extension of field AI Net work through MAITRI (Multi Purpose AI Technician in Rural India) and to encourage conservation and development of recognized indigenous breeds of the country. The NPDD will focus on creating infrastructure related to production, procurement, processing and marketing of milk and milk products by the State Implementing Agency (SIA), State Milk Marketing Federations/ District Cooperative Milk Producers’ Union and manpower development activities including training of milk producers associated to dairy cooperative societies.
The budgetary provision of 1,800 crore has been provided for implementation of NPBBDD during 12th Plan
and an amount of 150 crore has been allocated for the year 2015-16 under it. Out of it an amount of 74 crore
was allocated for financial year 2015-16 under the component of NPDD.
Under NPDD component, 15 new projects in four states have been approved with total outlay of 142.84 crore till March 2015. A total sum of 89.97 crore including 41.52 crore for new projects were released for
implementation of projects approved under the scheme during the year 2014-15.
National Dairy Plan Phase-I
National Dairy Plan was launched in March 2013 with the objective of increasing productivity of milk animals and providing rural producers greater access to organized milk processing sector and is being implemented by National Dairy Development Board (NDDB) focusing on 14 major milk producing states and Chhattisgarh. NDP-I has a total outlay of 2,242 crore comprising external aid of 1,584 crore and GoI share of 176 crore.
Dairy Entrepreneurship Development
Dairy Entrepreneurship Development Scheme (DEDS) was launched in September, 2010 with the objective for promotion of private investment in dairy sector to increase the milk production and helping in poverty reduction through self employment opportunities. This scheme is being implemented through NABARD which provides financial assistance to commercially bankable projects with loans from commercial, cooperative, urban and rural banks with a back ended capital subsidy of 25 per cent of the project cost to the beneficiaries of general category and 33.33 per cent of the project cost to SC and ST beneficiaries. The scheme is being continued with certain modifications and a budget provision of 1,400 crore during 12th Plan. Since its inception, an amount of 842.92 crore has been disbursed by NABARD as back ended capital subsidy to the beneficiaries.
National Livestock Mission
Since 2014-15 and 2015-16, National Livestock Mission (NLM) is being implemented with the objectives of sustainable development of livestock sector, focusing on improving availability of quality feed and fodder, risk coverage, effective extension, skill development, improved flow of credit and organization of livestock farmers/rearers, etc. The other objectives are development of small ruminants, piggery and poultry, there are programmes for strengthening the state farms in terms of modernization, automation and biosecurity to enable production of improved breed of goats, sheep, pigs and stocks of low input technology chicken. Further, the productivity enhancement component provides for supporting BPL families to encourage rearing of backyard poultry and community-led breed improvement programmes. Similarly, under the Entrepreneurship Development and Employment Generation component there is provision for a number of small ruminants, piggery and poultry farming and allied activities wherein back-ended capital subsidy is provided to the farmers.
Sub-Mission on Livestock Development
Sheep and Goat Development
According to Livestock census 2012, there are about 65.07 million sheep and 135.2 million goats in the country. About five million households in the country are engaged in the rearing of small ruminants (sheep and goats) and other allied activities.
Central Sheep Breeding Farm
Central sheep Breeding Farm, Hisar is mandated to produce acclimatized exotic/ cross bred superior quality rams. The farm supplies rams and bucks to different state agencies and farmers and trains farmers in machine – shearing techniques.
Conservation of Threatened Breeds
The population of purebred animals of some breed of small ruminants, equines, pigs and pack animal has come down considerably; in some cases, even below 10,000 which has brought such breeds to the category of ‘threatened breeds’ in the country. A Centrally Sponsored Scheme for conservation of such threatened breeds was started during 10th Five Year Plan with a budget outlay of 15.00 crore. Farms/ farmers unit in their respective breeding tract are established under the scheme with 100 per cent central assistance. The
conservation projects are being implemented by state governments, universities and NGOs. During the 10th Plan period conservation projects for 27 breeds were taken up.
Integrated Development of Small Ruminants and Rabbits
This Central Sector Scheme was approved in 2009 for implementation during 12th Plan with an allocation of
134.825 crores. Allocation under the scheme during 2012-13 was 15.00 crore. The scheme envisages setting up of intensive small ruminant development clusters with venture capital through NABARD as well as infrastructure development and institutional restructuring through state implementing agency. During 2014-15, the scheme Integrated Development of Small Ruminants was subsumed under National Livestock Mission (Component [III])— Integrated Development of Small Ruminants and Rabbits under the Sub-Mission on Livestock Development).
Meat and Pig Development
The pig farming constitutes the livelihood of rural poor belonging to the lowest socio-economic strata and they have no means to undertake scientific pig farming with improved foundation stock, proper housing, feeding and management.
Therefore, suitable schemes to popularise the scientific pig breeding-cum-rearing of meat producing animals with adequate financial provisions are necessary to modernise the Indian pig industry and to improve the productivity of small sized rural pig farms. The component – Entrepreneurship Development and Employment Generation of the scheme-National Livestock Mission (NLM) encourages commercial rearing of pigs by adopting scientific methods and creation of infrastructure. The Mission also supports state pig breeding farms for strengthening of existing breeding infrastructure.
Risk Management
The Risk Management as a component of sub-mission on livestock development of NLM is to be implemented in all the districts of the country including those carved out in future, if any. This component aims towards management of risk and uncertainties by providing protection mechanism to the farmers against any eventual loss of their animals due to death; and to demonstrate the benefit of insurance of
livestock to the people. The indigenous/crossbred milk animals, pack animals (horses, donkey, mules, camels, ponies and cattle/buffalo male), and other livestock (goat, sheep, pigs, rabbit, yak, mithun, etc.) will be under the purview of this component. Benefit of subsidy is to be restricted to 5 animals per beneficiary per household for all animals except for sheep, goat, pig and rabbit, where the benefit will be restricted to 5 cattle units (1 cattle unit = 10 sheep/goats/pigs/rabbits). Therefore the benefit of subsidy to sheep, goat, pig and rabbit is to be restricted to 5 ‘Cattle Unit’ per beneficiary per house hold.
However, if a beneficiary has less than 5 animals/1cattle unit can also avail the benefit of subsidy.
Poultry Development
Poultry is one of the fastest growing subsectors of animal husbandry with annual growth rates of eggs of around 6 per cent per annum.
The achievements and growth rates are being sustained despite the ingress of avian influenza which was a severe setback for the industry, showing the resilience of poultry sector, perseverance of the private sector and timely interventions by the government. A general guideline for biosecurity on poultry farms has been compiled and circulated to all states for taking preventive measures against ingress of diseases.
Modernization and Development of Breeding Infrastructure
Central Poultry Development Organizations
The Central Poultry Development Organizations (CPDOs) located at four regions viz., Chandigarh, Bhubaneswar, Mumbai and Hessarghatta have been playing a pivotal role in the implementation of the policies of the Government with respect to poultry. The mandate of these organizations has specially been reoriented to focus on improved birds, which lay on an average 180-200 eggs per annum and have
vastly improved feed conversion ratio in terms of feed consumption and weight gain. In these CPDOs, training is also imparted to the farmers to upgrade their technical skills. CPDO and Training Institute, Hessarghatta is also imparting trainers’ training to in-service personnel from within the country as well as overseas.
The Central Poultry Performance Testing Center (CPPTC), located at Gurgaon is entrusted with responsibility of testing the performance of layer and broiler varieties. This centre gives valuable information relating to different genetic stock available in the country.
Strengthening of Breeding Infrastructure
It aims at strengthening existing state poultry farms so as to enable the flow of suitable germplasm from the research institutions/laboratories to the grassroots level along with other technical services through capacity building of state poultry farms; and developing and implementing package of practices at the ground level for different types of poultry system including family poultry system for supplementary income generation and family nutrition. The assistance provided is 75 per cent Central share to all states/union territories. One time operational/revolving fund is provided to these farms for smooth operations maintenance to ensure long term sustainability.
Interventions towards Productivity Enhancement Rural Backyard Poultry Development
This component is envisaged to cover beneficiaries from Backyard Poultry Development (BPD) families to enable them to gain supplementary income and nutritional support.
Under this programme so far funding has been done to cover around 1.45 lakh BPL beneficiaries.
There has been persistent demand from the north-eastern states seeking support for all round development of pigs in the region. Therefore, pig development in the region is being implemented as a sub-mission of NLM. The submission strives to forge synergies of research and development organizations through appropriate interventions, as required for holistic development of pigs in the north-eastern region including genetic improvement and health cover.
Under the scheme cultivation of fodder and preservation of fodder by using post harvest technologies is supported.
Further, to improve the seed replacement scenario, this department has taken up production of foundation seeds from breeder seed at its eight regional fodder stations for last two years. For production of certified seeds from the foundation seeds, this department has introduced the component of ‘Fodder Seed Procurement and Distribution’.
Under the programme, after producing the foundation seeds at all our regional stations, the same is being offered to the states for further multiplication by the state governments preferably through milk federations, dairy co-operatives and progressive farmers, etc., under buy back arrangement for production of certified seeds. For this assistance is provided to the states under the component fodder seed production/ procurement and distribution.
Sub-Mission on Skill Development, Technology Transfer and Extension
The component will provide extension, education, production of livestock, extension literature. The IEC programme for the state would be finalized by factoring in the specific characteristics of each district and block. In knowledge-driven development, there is need for providing extension education keeping in view the diverse needs of the livestock owners not only on production procedures, but also the knowledge about the whole range of livestock— business, production systems, research institutions, programmes and schemes of the development departments, quality certification and reporting procedures, grading, packaging, storage, transportation and other requirements of both domestic and export markets, including interfaces at different levels with unlimited partners. The development of Information Communication Technology (ICT) and telecommunication network have paved the way for creation of information network, knowledge pool and services which can be intensively used for the purpose.
Fisheries
India is the second largest producer of fish in the world contributing 5.68 per cent of global fish production. It is also a major producer of fish through aquaculture and ranks second in the world after China. Fishery is one of the most promising sectors of agriculture and allied activities in India, with an overall growth rate of 6 per cent projected during the 12th Five year Plan.
India is blessed with vast aquatic resources with a rich diversity of fish fauna for sustainable utilization. Our
Country is recognized to harbour about 2,200 species of fish, which accounted for about 11 per cent of all fish species reported globally. About 24.7 per cent of our fish species live in warm fresh water; 3.3 per cent in cold water; 6.5 per cent in estuaries and the rest 65.5 per cent in the sea.
Inland Fisheries and Aquaculture
Aquaculture is the fastest growing food producing sector in the world with an annual growth of around 7 per cent. India is the second largest producer of fish both in total, and from aquaculture. Increasing demand for fish and fishery products would mostly be sourced from aquaculture and culture based capture fisheries in reservoirs as capture fisheries growth world over is stagnant.
Marine Fisheries
Harvesting of marine fisheries resources in the country warrants stronger emphasis on invoking technological innovations as well as management paradigms that reconcile livelihood issues with concerns on resource conservation.
Global production of fish from marine capture fisheries in the last decade has stagnated gradually and many stocks have been either over-exploited or have reached their maximum sustainable yields.
On-going Schemes
- Development of Inland Fisheries and Aquaculture;
ii. Development of Marine Fisheries, Infrastructure and Post Harvest Operations;
iii. National Scheme of Welfare of Fishermen;
iv. Strengthening of Database and Geographical Information System for the Fisheries Sector;
v. Assistance to Fisheries Institutes;
vi. National Fisheries Development Board; and
vii. Issuance of Biometric Identity Cards to Coastal Fishermen.
Blue Revolution
All the existing schemes of fisheries sector have been brought under the umbrella of ‘Blue Revolution’ for growth of fisheries and aquaculture in the country. Blue Revolution refers to an integrated and holistic approach towards the development and management of the fisheries and aquaculture sector in the country for increased production and productivity.
Livestock Health
Livestock sector plays an important role in national economy and socio-economic development of the country. Livestock sector has immense potential for growth. The biggest impediment to growth of this sector, however, is the large-scale prevalence of animal diseases. The disease in livestock results in both
morbidity and mortality with consequent production losses.
Therefore, to effectively tackle the issue of livestock health, to reduce the losses and thereby enabling livestock ownersto derive optimum gains from their animals, Government of India supplements the efforts of State Governments for prevention and control of animal diseases by providing assistance under various components of a Centrally Sponsored Scheme ‘Livestock Health and Disease Control (LH and DC)’, now renamed as ‘Veterinary Services andAnimal Health’.
An online system of animal disease reporting in a time bound manner is being implemented for reporting of animal diseases for immediate action to control the disease. Under this each taluka/district and state headquarter is linked with a Central Disease Monitoring Unit in DADF at New Delhi.
To strengthen laboratory infrastructure, the department has established four pre-fabricated Bio-Safety Level-III (BSLIII) laboratories (one each at Kolkata, Jalandhar, Bareilly and Bengaluru). One Mobile BSL-III laboratory is available at NERDDL, Guwahati, Assam. About 23 State Disease Diagnostic Laboratories are being upgraded to BSL-II level, out of which, 18 are functional and remaining are at various stages of completion.
.
Irrigation
- Overview
- Developments of Irrigation in India
- Types of Irrigation
- Multipurpose River-Valley Projects in India
Overview
Irrigation in India includes a network of major and minor canals from Indian rivers, groundwater well based systems, tanks, and other rainwater harvesting projects for agricultural activities. Of these groundwater system is the largest. In 2013-14, only about 47.7% of total agricultural land in India was reliably irrigated. The largest canal in India is Indira Gandhi Canal, which is about 650 km long. About 2/3rd cultivated land in India is dependent on monsoons. Irrigation in India helps improve food security, reduce dependence on monsoons, improve agricultural productivity and create rural job opportunities. Dams used for irrigation projects help produce electricity and transport facilities, as well as provide drinking water supplies to a growing population, control floods and prevent droughts.
Developments of Irrigation in India
Past Initiatives
1. Extension of Irrigated Area:
Five year plans have made extensive arrangement for extending the area under irrigation. At the time of independence, about 19 per cent of agricultural land of India was under irrigation system as against 41 per cent in Pakistan, 36 per cent in Israel, 52 per cent in Japan and near 100 per cent in Egypt. During the planning period, stress has been laid on the extension of irrigation facilities throughout the country.
As a result of that, at the end of 1997-98, 86.6 million hectares of land was irrigated which comes about 46.5 per cent of total cultivable area (186 million hectares) of the country? Among all the states, the extent of coverage of irrigation is highest in Punjab (73 per cent) followed by 50 per cent coverage in Haryana.
2. Development of Multi-purpose Projects:
In the meantime a good number of multi-purpose river projects has been completed under the plans for extensive utilisation of river water for irrigation purposes along with other uses.
3. Development of Minor Irrigation Projects:
Five year plans in India have also made extensive arrangement for the development of minor irrigation projects including wells, tanks, tube wells, pump sets etc. to extend irrigation facilities to small and marginal farmers.
4. Command Area Development Programme:
In 1974-75, the Command Area Development Programme was launched for the maximum possible utilisation of irrigation potential. Its main objective is to reduce the gap between the actual irrigation potential and its utilisation.
This scheme was also introduced for increasing the agricultural production from the irrigated commands. This programme envisaged execution of on farm development works like construction of field channels, land levelling or shaping and adoption of the warabandi system (network of distributaries over the command area) for rotational supply of water and construction of field drains.
Besides, the programme also encompasses adaptive trails, demonstration and training of farmers and suitable cropping pattern. As on 31st March 1997, Rs 4,472 crore was spent on the programme for 240 projects covering a command area of around 273 lakh hectares. In 1997-98, Rs 129.68 crore were released to states as central assistance under the programme.
This CAD programme is currently known as Command Area Development and Water Management Programme (CAD & WM). The programme, with a multi-disciplinary team and Area Development Authority, envisaged integration of all activities relating to irrigated agriculture in a coordinated manner.
Initially 60 major and medium irrigation projects were taken up under the CAD Programme, coverage a Culturable Command Area (CCA) of about 15 million hectare. Between 1974-75 until end-December 2006 311 projects with a CCA of 28.58 million hectare have been included under the programme.
5. Irrigation Commission and its Principles:
In India Irrigation Commission has underlined following three principles for the utilization of irrigation water:
(i) To stimulate productivity of land in those areas where sufficient irrigation facilities has already been developed through judicious use of water;
(ii) Optimum utilization of irrigation water where such facilities are not developed in abundance; and
(iii) To conserve water for facing drought like situation where irrigation facilities are insignificant. The Commission has earmarked the ultimate irrigation potential at 114 million hectares.
6. Progress of Cumulative Irrigation Potential:
Under the Five Year Plans, the cumulative irrigation potential has achieved a considerable progress under the patronage of both Central and State governments.
Data reveals that the cumulative irrigation potential developed has increased from 22.6 million hectares during the pre-plan period to 26.3 million hectares during the First Plan and the cumulative utilization of such potential was 25.1 million hectares.
But the same potential has reached the level of 44.2 million hectares during the Fourth Plan and then to 76.5 million hectares during the Seventh Plan and finally to 89.5 million hectares during the Eighth Plan out of which the cumulative utilization figure during the Eighth Plan was 80.7 million hectares.
The target for the cumulative irrigation potential during the Ninth Plan is fixed at 106.4 million hectares and that of cumulative utilisation is fixed at 94.4 million hectares and the actual realization was 94.7 million hectares and 84.7 million hectares respectively at the end of Ninth Plan.
Again at the end of the Tenth Plan, total irrigation potential in the country has increased to 102.8 million hectares and the cumulative utilisation of this potential was only 87.2 million hectares. The potential created so far is estimated to be 73.5 per cent of the ultimate irrigation potential of the country.
Again total irrigation potential of the country has increased from 81.1 million hectares in 1991-92 to 108.2 million hectares in March 2011. The pace of creation of additional irrigation potential came down sharply from an average of about 3 per cent per annum during the period 1950-51 to 1989-90 to 1.2 per cent, 1.7 per cent and 1.8 per cent per annum respectively during the Eighth, Ninth and Tenth Plan periods.
The rate of growth of utilisation of the potential created declined to 1.0 per cent per annum during the Ninth Plan period and then improved to 1.5 per cent per annum during the Tenth Plan period.
The average annual rate of utilisation remained lower than the average annual addition to the irrigation potential resulting in the cumulative utilisation witnessing a continuous erosion. This not only results to an inefficient use of funds but also created a forgone income from irrigated lands.
The ultimate irrigation potential (UIP) has been reassessed at 139.89 million hectares (m ha). This is based on the reassessment of the ground water potential raised to 64.05 m. ha from 40 m. ha assessed earlier and the assessment potential of surface minor irrigation has been reassessed from 15.0 m. ha to 19.38 m ha. Thus, there has been an increase of 26.39 m. ha in the ultimate irrigation potential of the country which was assessed earlier at 113.5 million hectares.
7. Development of Agency and Programme for better Utilisation – AIBP:
The Government in the mean time has set up National Water Development Agency for formulating various programmes for the utilisation of water resources.
With a view to ensure early completion of projects for providing irrigation benefits to the farmers, the Government of India launched Accelerated Irrigation Benefit Programme (AIBP) in 1996-97, under which the Centre provides additional central assistance by way of loans to the states on matching basis for early completion of selected large irrigation and multi-purpose projects.
An amount of Rs1500 crore and Rs 952.19 crore was released under AIBP as central loan assistance to the states during 1996-97 and 1997-98 respectively.
Under the AIBP, Rs 67,195 crore of Central Loan Assistance (CLA)/grant has been released up to December 2014.
An irrigation potential of 8,503.0 thousand hectares is reported to have been created by states from major, medium and minor irrigation projects under the AIBP till March 2013,’ The Command Area Development Programme has also been amalgamated with the AIBP to reduce the gap between irrigation potential that has been created and that is utilised.
8. Impact on Food Production:
With the increase in irrigation potential to 89.3 million hectares, the production of food grains has increased from 55 million tonnes in 1949-50 to 212.0 million tonnes in 2001- 2002. Accordingly, the per capita availability of food grains has also increased from 395 grams to around 512 grams per day.
9. River Basin-wise Planning:
In order to attain a better use of water resources, the National Water Policy has suggested to treat river basin as the basis of water resources planning. Full utilisation of water resources is impossible in the absence of basin-wise planning. Such planning would help in projecting the probable infiltration of water and take necessary steps against soil erosion.
10. Restoration of Water Bodies:
Under a massive scheme for repair, renovation and restoration of water bodies directly linked to agriculture landed by the Union Finance Minister in the budget speech of 2004-05, it is proposed to restore water bodies throughout India to their original glory resulting in a significant enhancement of their storage capacity.
For this purpose, a pilot scheme to be implemented during the remaining period of the Tenth Plan was approved by Government in January 2005 with an estimated cost of Rs 300 crore. It is a state sector scheme, with a proposed finding pattern of Centre: State of 75: 25. Ministry of Water Resources has approved pilot projects in 26 districts of 15 states at an estimated cost of Rs 300.0 crore till end December 2007.
Under this National Project for Repairs, Renovation and Restoration of Water Bodies directly linked to agriculture, the central share of Rs 179.3 crore has been released to the states till November 30, 2007, covering 1,096 water bodies. The physical Work for restoration has been completed for 733 water bodies and the work is in progress in the remaining 365 water bodies.
Following the pilot scheme, restoration of water bodies has also been taken up in states having considerable number of water bodies with the World Bank assistance. The World Bank loan agreement has been signed with Tamil Nadu, for Rs 2,182 crore to restore 5,763 water bodies having a cultivated command area (CCA) of 4 lakh hectare.
The Rs. 835 crore Andhra Pradesh Community based Tank Management Project was signed with the World Bank in June 2007 for restoration of 3,000 water bodies with a CCA of 2.5 lakh hectare.
The project of Karnataka was also signed for Rs 259 crore with the World Bank in November 2007 for restoration of 1,225 water bodies involving a CCA of 0.52 lakh hectare. The proposals from Orissa and West Bengal Governments have also been submitted to the World Bank.
11. Irrigation Development under Bharat Nirman:
Irrigation has been undertaken as one of the six components for development of rural infrastructure under ‘Bharat Nirman’. The irrigation Component ‘Bharat Nirman’ aims at creation of irrigation potential of 10 million hectare in the four years from 2005-06 to 2008-09.
Keeping in view the present states, the target for creation of irrigation potential under Bharat Nirman has been proposed to be met largely through Completion of on-going major and medium irrigation projects.
Due emphasis has also been given to enhancing the utilisation of completed projects/schemes. Development of new projects of minor irrigation to cater to the requirement of specific areas especially to provide benefit to small and marginal farmers and dalits and tribals, has also been included in Bharat Nirman.
Thus irrigation component of Bharat Nirman is likely to play an important role for enhancing the irrigation potential of the country.
12. Irrigation Development under Eleventh Plan:
The Working Group on Water Resources for the Eleventh Five Year Plan (2007-12) has proposed creation of irrigation potential of 16 million hectares (9 million hectares from MMI sector and 7 million hectares from MI sector) during the Eleventh Plan period.
Recent Initiatives
Pradhan Mantri Krishi Sinchai Yojana – PMKSY
The broad objectives of PMKSY include
- Achieve convergence of investments in irrigation at the field level (preparation of district level and, if required, sub district level water use plans).
- Enhance the physical access of water on the farm and expand cultivable area under assured irrigation (Har Khet ko pani).
- Integration of water source, distribution and its efficient use, to make best use of water through appropriate technologies and practices.
- Improve on – farm water use efficiency to reduce wastage and increase availability both in duration and extent.
- Enhance the adoption of precision – irrigation and other water saving technologies (More crop per drop).
- Enhance recharge of aquifers and introduce sustainable water conservation practices.
- Ensure the integrated development of rainfed areas using the watershed approach towards soil and water conservation, regeneration of ground water, arresting runoff, providing livelihood options and other NRM activities.
- Promote extension activities relating to water harvesting, water management and crop alignment for farmers and grass root level field functionaries.
- Explore the feasibility of reusing treated municipal waste water for peri – urban agriculture.
- Attract greater private investments in irrigation.
Programme implementation
- Krishi Sinchayee Yojana with an outlay of Rs.50,000 crores for a period of 5 years (2015-16 to 2019-20) is to achieve convergence of investments in irrigation at the field level.
- PMKSY has been formulated amalgamating ongoing schemes viz. Accelerated Irrigation Benefit Programme (AIBP) of Ministry of Water Resources, River Development & Ganga Rejuvenation; Integrated Watershed Management Programme (IWMP) of Department of Land Resources; and On Farm Water Management (OFWM) component of National Mission on Sustainable Agriculture (NMSA) of Department of Agriculture and Cooperation.
- PMKSY is to be implemented in an area development approach, adopting decentralized state level planning and projectised execution, allowing the states to draw their irrigation development plans based on district/blocks plans with a horizon of 5 to 7 years. States can take up projects based on the District/State Irrigation Plan.
- All the States and Union Territories including North Eastern States are covered under the programme.
- The National Steering Committee (NSC) of PMKSY under the chairmanship of Hon’ble Prime Minister, will provide policy direction to programme framework and a National Executive Committee (NEC) under the chairmanship of Vice Chairman of NITI Aayog will oversee the programme implementation at national level.
- Provision has been made under PMKSY during 2015-16 for carrying out extension activities in the field with special focus on water harvesting, water management and crop alignment for farmers and grass root level field functionaries.
Programme Components
A. Accelerated Irrigation Benefit Programme (AIBP)
- To focus on faster completion of ongoing Major and Medium Irrigation including National Projects.
B. PMKSY (Har Khet ko Pani)
- Creation of new water sources through Minor Irrigation (both surface and ground water)
- Repair, restoration and renovation of water bodies; strengthening carrying capacity of traditional water sources, construction rain water harvesting structures (Jal Sanchay);
- Command area development, strengthening and creation of distribution network from source to the farm;
- Ground water development in the areas where it is abundant, so that sink is created to store runoff/ flood water during peak rainy season.
- Improvement in water management and distribution system for water bodies to take advantage of the available source which is not tapped to its fullest capacity (deriving benefits from low hanging fruits). At least 10% of the command area to be covered under micro/precision irrigation.
- Diversion of water from source of different location where it is plenty to nearby water scarce areas, lift irrigation from water bodies/rivers at lower elevation to supplement requirements beyond IWMP and MGNREGS irrespective of irrigation command.
- Creating and rejuvenating traditional water storage systems like Jal Mandir (Gujarat); Khatri, Kuhl (H.P.); Zabo (Nagaland); Eri, Ooranis (T.N.); Dongs (Assam); Katas, Bandhas (Odisha and M.P.) etc. at feasible locations.
C. PMKSY (Per Drop More Crop)
- Programme management, preparation of State/District Irrigation Plan, approval of annual action plan, Monitoring etc.
- Promoting efficient water conveyance and precision water application devices like drips, sprinklers, pivots, rain – guns in the farm (Jal Sinchan);
- Topping up of input cost particularly under civil construction beyond permissible limit (40%), under MGNREGS for activities like lining inlet, outlet, silt traps, distribution system etc.
- Construction of micro irrigation structures to supplement source creation activities including tube wells and dug wells (in areas where ground water is available and not under semi critical /critical /over exploited category of development) which are not supported under AIBP, PMKSY (Har Khet ko Pani), PMKSY (Watershed) and MGNREGS a s per block/district irrigation plan.
- Secondary storage structures at tail end of canal system to store water when available in abundance (rainy season) or from perennial sources like streams for use during dry periods through effective on – farm water management;
- Water lifting devices like diesel/ electric/ solar pumpsets including water carriage pipes, underground piping system.
- Extension activities for promotion of scientific moisture conservation and agronomic measures including cropping alignment to maximise use of available water including rainfall and minimise irrigation requirement (Jal sarankchan);
- Capacity building, training and awareness campaign including low cost publications, use of pico projectors and low cost films for encouraging potential use water source through technological, agronomic and management practices including community irrigation.
- The extension workers will be empowered to disseminate relevant technologies under PMKSY only after requisite training is provided to them especially in the area of promotion of scientific moisture conservation and agronomic measures, improved/ innovative distribution system like pipe and box outlet system, etc. Appropriate Domain Experts will act as Master Trainers.
- Information Communication Technology (ICT) interventions through NeGP – A to be made use in the field of water use efficiency, precision irrigation technologies, on farm water management, crop alignment etc. and also to do intensive monitoring of the Scheme.
D. PMKSY (Watershed Development)
- Effective management of runoff water and improved soil & moisture conservation activities such as ridge area treatment, drainage line 5 treatment, rain water harvesting, in – situ moisture conservation and other allied activities o n watershed basis.
- Converging with MGNREGS for creation of water source to full potential in identified backward rainfed blocks including renovation of traditional water bodies
Types of Irrigation
Tanks:
It is prevalent in the uneven and relatively rocky plateau of Peninsular India. Tanks are commonly used in Deccan Plateau, Andhra Pradesh, Karnataka, Tamil Nadu and Maharashtra. About 8% of total irrigated area is irrigated by tanks.
Most of the tanks are small in size and built by individuals or group of farmers by raising bunds across seasonal streams. But there are some drawbacks: Tanks cover a large areas of cultivable land. Evaporation of water is rapid due to large expanse of shallow water of tanks, do not ensure perennial supply of water.
Well:
It is more widespread in plains, coasts and some regions of peninsular India. It is less costly and more flexible as water can be drawn whenever needed and ‘evaporation loss’ is minimised and no fear of “over irrigation”. Uttar Pradesh leads in well irrigation and is followed by Punjab, Haryana, Bihar, Gujarat and Andhra Pradesh.
Wells are of two types:
Open wells and tube-wells. Open wells are shallow and irrigate a small area because water available is limited. Tube wells are deep and have the capacity to draw a large volume of water. It has increased in recent years..
Canals:
Canals are the main source of irrigation in India. Canals are big water channels taken out from rivers to carry water to places far away from the river.
It is of two types: Canals taken out from rivers without any regulating system like weirs etc. at their head are called inundation canals and canals taking off from perennial rivers with a weir system to regulate flow of water are called perennial canals.
Punjab and Haryana have become the first granaries of country due to these canals which include Western Yamuna Canal, Sirhind Canal, Upper Bari Doab canal & Bliakra Canal. The important canals of Uttar Pradesh are upper and lower Ganga Canal, Agra and Sharda Canal and Rajasthan has become third granary due to Rajasthan canal project.
Top 10 States irrigation types, capacity and actual
Column 1 – Rank
Column 2 – State
Column 3 – Total crop area (million hectares)
Column 4 – Groundwater irrigation crop area (million hectares)
Column 5 – Canal irrigation crop area (million hectares)
Column 6 – Total crop area actually irrigated (million hectares)
|
1 |
2 |
3 |
4 |
5 |
6 |
|
1 |
UP |
17.6 |
10.64 |
4.21 |
14.49 |
|
2 |
Rajasthan |
21.1 |
3.98 |
1.52 |
5.12 |
|
3 |
Andhra P. |
14.3 |
2.5 |
2.7 |
4.9 |
|
4 |
MP |
15.8 |
2.74 |
1.7 |
4.19 |
|
5 |
Punjab |
4 |
3.06 |
0.94 |
3.96 |
|
6 |
Bihar |
6.4 |
2.2 |
1.3 |
3.5 |
|
7 |
Maha. |
19.8 |
3.12 |
1.03 |
3.36 |
|
8 |
Haryana |
3.6 |
1.99 |
1.32 |
3.26 |
|
9 |
Gujarat |
9.9 |
3.1 |
0.5 |
3.2 |
Multipurpose River-Valley Projects
Dams were traditionally built to impound rivers and rainwater that could be used later to irrigate agricultural fields. Today, dams are built not just for irrigation but for:
electricity generation,
water supply for domestic and industrial uses,
flood control,
recreation,
inland navigation,
fish breeding etc.
Hence dams are now referred to as multipurpose projects where the many uses of the impounded water are integrated with one another. For example, in the Satluj-Beas river basin, the Bhakra Nangal project water is being used both for hydel power production and irrigation. Similarly, the Hirakud project in the Mahanadi basin integrates conservation of water with flood control.
Important River Water Projects
1. Almatti Dam
It is a hydroelectric project constructed on the river Krishna.
2. Baspa Hydro-Electric Project
It is the first Independent Power Producer (IPP) project after the Government of India liberalized the power policy by inviting private sector participation in setting up a hydropower project on “BOO” basis. It is located in Kinnaur district of Himachal Pradesh. It is the largest private hydroelectric project and has been built by Jaypee group. It is located on Baspa River, a tributary of the Satluj.
3. Beas Project
It is a joint venture of the governments of Punjab, Haryana and Rajasthan. It consists of two units: (i) Beas-Sutlej Link and (ii) Beas Dam at Pong. The project links the Beas and the Sutlej rivers in Punjab through 38.4 km of hills and valleys. The waters of the Beas were poured into the mighty Sutlej river on July 10, 1977 at the first-ever man-made confluence of the two major rivers at Slapper in Himachal in a mighty bid to augment the water resources of the Gobind Sagar Lake of the Bhakra-complex. This completed the Rs 380- crore dream which was realised in a period of only 12 years.
4. Bhadra Reservoir Project
It is constructed across the river Bhadra which is in Karnataka.
5. Bhakra-Nangal
Project (Himachal Pradesh) Largest multipurpose project in India and the highest straight gravity dam in the world (225.5 m high) on the river Sutlej.
6. Chambal Valley Project
It is a joint undertaking by the Rajasthan and Madhya Pradesh governments. The Rana Pratap Dam at Bhata, 48 km from Kotah, was inaugurated on Feb 9, 1970. The project comprises construction of two other dams: Gandhi Sagar Dam in Madhya Pradesh and Jawahar Sagar (Kotah) Dam in Rajasthan.
7. Chamera Hydro-Electric Project
The 540 MW Chamera hydro-electric project on the Ravi river in Himachal Pradesh was implemented with Canadian credit offer of about Rs 335 crore.
8. Chukha Project
The 336 MW project is the most prestigious and largest in Bhutan. It has been completely built by India. The dam has been constructed on Wang Chu River. The project costed Rs 244 crore.
9. Damodar Valley Project (West Bengal and Bihar)
Principal object of this multipurpose scheme is to control the flowing of the Damodar which is notorious for its vagaries and destructiveness. It is designed on the lines of the Tennessee Valley Authority (T.V.A.) in U.S.A.
10. Dul-Hasti Hydro-Electric Project
The Rs. 1263 crore project is being built on river Chenab in Jammu and Kashmir. The foundation of the project was laid in September 1984. The project will consist of a power plant of 390 MW capacities. The power house will be located underground.
11. Dhauliganga Project
The Rs. 600 crore, 280 MW project is to be located on Dhauliganga River in Uttaranchal.
12. Farakka Barrage
The basic aim of the Farakka Barrage is to preserve and maintain Calcutta port and to improve the navigability of the Hooghly river. It consists of a barrage across the Ganga at Farakka, another barrage at Jangipur across the Bhagirthi, a 39-km long feeder canal taking off from the right bank of the Ganga at Farakka and tailing into the Bhagirathi below the Jangipur barrage, and a road-cum-rail bridge have already been completed. Specially, the object of Farakka is to use about 40,000 cusecs of water out of the water stored in the dam to flush the Calcutta port which is getting silted up.
13. Gandak Project (Bihar and U.P)
This is a joint venture of India and Nepal as per agreement signed between the two governments on Dec 4, 1959. Bihar and Uttar Pradesh are the participating Indian States. Nepal would also derive irrigation and power benefits from this project.
14. Hirakud Project (Odisha)
It is the first of a chain of three Dams planned for harnessing the Mahanadi.
15. Idukki Hydro-Electric Project
It is a giant hydro-electric project of Kerala and one of the biggest in the country, constructed with Canadian assistance with an installed capacity of 390 MW in the first stage and 780 MW in the second stage. The project envisages to harness Periyar waters, has three major dams, the 169 m high Idukki arch dam across Periyar river, 138 m high Cheruthoni Dam across the tributary of Cheruthoni river and 99.9 m high Kulamavu Dam.
16. Jayakwadi Dam (Maharashtra)
The 10-km-long Jayakwadi dam on the Godavari is Maharashtra’s largest irrigation project located near Paithan.
17. Kalpong Hydro-Electric Project
This is the first hydel power plant of Andaman and Nicobar Islands. The 5.25 MW project was commissioned on July 1, 2001. It is located near Kalara village of Diglipur Tehsil in North Andaman and has been built by National Hydel Power Corporation.
18. Kakrapara Project
It is situated on the Tapti near Kakrapara, 80 km upstream of Surat. The project is financed by the Gujarat Government.
19. Koel Karo Project
The project envisages construction of earthen dam across river south Koel at Basia in Bihar and another dam over north Karo at Lohajimi. The capacity will be 710 MW.
20. Kol Project
The 600 MW project is to be located on the Satluj, 6 km upstream of the Dehar Power House on the Beas-Satluj link project in Mandi district, Himachal Pradesh. Besides generating power, the dam will also serve as a check dam for the 1,050-MW Bhakra Dam and prolong its life by at least 10 years.
21. Kosi Project
This project will serve Bihar and Nepal. The Kosi rises in Nepal, passes through Bihar and joins the Ganges. The river is subject to heavy floods. Two dams are to be built across it.
22. Nagarjunasagar Project
This Project is a venture of Andhra Pradesh for utilizing water of the Krishna River. The Nagarjunasagar Dam was inaugurated on Aug 4, 1967. It is situated near Nandikonda village in Miryalguda Taluk of Nalgonda district.
23. Nathpa-Jhakri Hydro-Electric Project
India’s largest hydro-electric project, it is located at Nathpa Jhakri in Himachal Pradesh. It is built on Satluj River. The first of the six 250 MW units was commissioned on December 30, 2002. The project is being executed by Satluj Jal Nigam (formerly Nathpa Jhakri Power Corporation).
24. Parambikulam Aliyar Project
It is a joint venture of Tamil Nadu and Kerala States. It envisages construction of seven inter-connected reservoirs by harnessing rivers including two major rivers viz., Parambikulam on the western slopes of Annamalai Hills and Aliyar on the eastern slopes.
25. Parappalar Dam
The Rs 1-crore Parappalar Dam with a storage capacity of 167 million cubic feet near Oddenchatram, about 75 km from Madurai in Palni taluk (Tamil Nadu), was inaugurated on August 30, 1976.
26. Parvati Valley Project
It is the first inter-State hydel power project of India. Gujarat, Rajasthan, Haryana and Delhi have joined hands with Himachal Pradesh to set up the project. The 2050 MW project will be built near Kullu, on Parvati river, a tributary of Beas.
27. Periyar Valley Scheme (Kerala)
The scheme envisages the construction of a masonry barrage 210.92 metres long across the river Periyar near Alwaye, in Ernakulam district.
28. Rajasthan Canal Project
It is a bold venture of bringing irrigation to a desert area. The project, which uses water from the Pong dam, consists of 215-km long Rajasthan feeder canal (with the first 178 km in Punjab and Haryana and the remaining 37 km in Rajasthan) and the 467-km long Rajasthan main canal lying entirely in Rajasthan.
29. Ramganga River Project
This Project in Uttaranchal envisages construction of a dam across the river Ramganga, one of the major tributaries of the Ganga at 3.2 km upstream of Kalagarh in Garhwal district. RANJIT SAGAR DAM PROJECT Formerly known as Thein dam, it was dedicated to the nation on March 4, 2001. It is built on the Ravi River near Thein village in Punjab. Total installed capacity is 600 MW.
30. Rihand Project (Mirzapur District—U.P)
This project has been completed by the U.P. Government and comprises the construction of a concrete gravity dam across the Rihand River in Mirzapur District (U.P.) and a Power House at Pipri and necessary transmission lines. Gobind Ballabh Pant Sagar is a part of this project.
31. Rongtong Project World’s Highest Hydro Power Project
It is ringtone project that is situated in Kazan in the Spiti Valley in Himachal Pradesh. The project has helped transform the entire cold mountain desert into a lush greenbelt.
32. Salal Project
It has been built on River Chenab in Jammu and Kashmir. The first stage was completed on February 9, 1989 and marked the beginning of the harnessing of hydro power potential of river Chenab. At present the capacity of the powerhouse is 345 MW. With the completion of the second stage the capacity will double.
33. Sankosh Hydel-Power Project
India and Bhutan have signed an agreement for building of a gigantic Sankosh hydel power project. It will be one among the ten largest projects in Asia. The project is to be constructed near Kerabari in Gaylegphug district of Bhutan on Sankosh River. It will include a 600 metre-long and 239 metre high dam and a reservoir with a catchment area of 10,525 sq km. It is estimated to cost around Rs 2000 crore. Once completed, the project will generate 1,525 MW of power and help irrigate eight lakh hectares of land.
34. Sanjay Vidyut (Hydel) Project
It is Asia’s first fully underground Hydel Project. The 120 MW project is located near Bhaba Nagar in Kinnaur district of Himachal Pradesh. It harnesses the water of the Bhaba Khud, a tributary of the Satluj.
35. Sardar Sarovar Project
It is one of the largest river valley schemes in the country. The project envisages construction of 163-metre-high cement concrete dam at Navagam in Gujarat. This will create irrigation potential of 1.79 million hectares and generate 1450 MW of power.
36. Sawalkote Hydro Project
The 600 MW project in Jammu & Kashmir is being built by a Norwegian consortium.
37. Sharavati Project (Karnataka)
It is located 400 km from Bangalore near the Gersoppa falls; the Sharavati Project is one of the world’s major power projects, built by Indian engineers with American collaboration.
38. Srisailarn Project
It is a massive power project, 110 km away from Nagarjunasagar in the upper reaches of the river Krishna.
39. Subarnarekha Project
It is Rs 130-crore multipurpose project, which would, when completed, provide assured irrigation to 7,06,000 acres to the chronically drought-prone areas of Orissa and Bihar.
40. Tehri Dam Project
The World’s fifth and Asia’s largest hydroelectric project has been constructed on river Bhagirithi, a tributary of Ganga in Tehri district of Uttaranchal. The height of the earth and rockfill dam is 260.5 m, making it the highest dam in the country. Once fully operational, the project will produce 1000 MW electricity.
41. Tungabhadra Project (Andhra And Karnataka)
It is a joint undertaking by the governments of Andhra Pradesh and Karnataka. The project comprises a dam across the Tungabhadra River near Mallapuram.
42. Ukai Project
It is a power project of Gujarat equipped with power generating sets manufactured by Bharat Heavy Electricals Limited was inaugurated on October 12, 1977. It has added a 540,000 KW of installed capacity to the State’s existing power network.
In the above list of Multipurpose River-Valley Projects in India will be concretising the general knowledge of the readers.
UPSC_Pre_MCQ
The canal-carrying capacity of Farakka is :[1997] (a)75,000 Cusecs (b)70,000 Cusecs (c)40,000 Cusecs (d)35,000 Cusecs
Ans.(c)The canal carrying capacity of Farakka barrage is 40,000 cusec. Farakka barrage is a 2245 metre long barrage across the river Ganga.
Which one of the following is the correct sequence of the states (labelled 1, 2, 3 and 4) of India shown on the map in descending order in terms of available ground water resources for irrigation?[1998] (a)3, 4, 1, 2 (b)3, 4, 2, 1 (c)4, 3, 1, 2 (d)4, 3, 2, 1
Ans.(d)Uttar Pradesh is the state where 9,384,000 hectare are covered by ground water irrigation. Maharashtra covers 1,912,000 hectare, West Bengal covers 1,397,000 hectares, Assam covers hectare for ground water irrigation.
With reference to India, which one of the following statements is not correct?[2002] (a)About one-third of the area of the country records more than 750 millimetres of annual rainfall (b)The dominant source of irrigation in the country is wells (c)Alluvial soil is the predominant type of soil in northern plains of the country (d)The mountain areas account for about thirty percent of the surface area of the country
Ans.(b)As per data of 2010–11. The source of irrigation in India is Tube wells – 45% Canals – 26% Wells – 19% Others – 7%
Consider the following statements:[2004] 1.Damodar, Valley Corporation is the first multi–purpose river valley project of independent India 2.Damodar Valley Corporation includes thermal and gas power stations Which of the statements given above is/are correct? (a)1 only (b)2 only (c)Both 1 and 2 (d)Neither 1 nor 2
Ans (a)Damodar Valley Corporation’s (DVC) is first multi-purpose river valley project of independent India was in the year 1954. The joint venture projects are Maithon Power Limited, Panchat and Tilayiya are hydroelectric power station. The DVC has under its operation four coal based thermal power stations, three hydel power stations and one gas turbine station so both the statement are correct.
Gandhi Sagar Dam is a part of which one of the following? [2005] (a)Chambal Project (b)Kosi Project (c)Damodar Valley Project (d)Bhakra Nangal Project
Ans.(a)Gandhi Sagar Dam is situated on the river Chambal in 1960, near Bhanpura of Madhya Pradesh.
With which one of the following rivers is the Omkareshwar Project associated?[2008] (a)Chambal (b)Narmada (c)Tapi (d)Bhima
On which one of the following rivers is the Tehri hydropower complex located?[2008] (a)Alaknanda (b)Bhagirathi (c)Dhauliganga (d)Mandakini
Ans.(b)The Tehri Hydropower complex is located on the Bhagirathi river of Uttar Pradesh.
Which of the following pairs are correctly matched? Irrigation ProjectState[2008] 1.Damanganga:Gujarat 2.Girna:Maharashtra 3.Pamba:Kerala Select the correct answer using the code given below: Code: (a)1 and 2 only (b)2 and 3 only (c)1 and 3 only (d)1, 2 and 3
Ans.(d)Damanganga water project is in Gujarat. Girna irrigation project is in Jalgaon area of Maharashtra. Pamba river is located in Kerala.
.
Population
Urbanisation in India
- India is a union of 29 states and 7 union territories.
- As of 2011, with an estimated population of 1.2 billion, India is the world’s second most populous country after the People’s Republic of China.
- India occupies 2.4% of the world’s land surface area and is home to 17.5% of the world’s population.
- After the Indo-Gangetic Plain, the eastern and western coastal regions of the Deccan Plateau are the most densely populated regions of India.
- The Thar Desert in western Rajasthan is one of the most densely populated deserts in the world.
- The northern and north-eastern states along the Himalayas contain cold arid deserts with fertile valleys.
GENERAL INFORMATION
2011 Census of India
|
Population |
Total |
1,210,854,977 |
|
Males |
51.51% |
|
|
Females |
48.49% |
|
|
Literacy |
Total |
74% |
|
Males |
82.10% |
|
|
Females |
65.46% |
|
|
Density of |
per km2 |
382 |
|
Sex ratio |
per 1000 males |
940 females |
|
Child sex ratio |
per 1000 males |
914 |
Census Facts 2011
- Thane district of Maharashtra is the most populated district of India.
- Dibang Valley of Arunachal Pradesh is the least populated.
- Kurung Kumey of Arunachal Pradesh registered highest population growth rate of 111.01 percent.
- Longleng district of Nagaland registered negative population growth rate of (-)58.39.
- Mahe district of Puducherry has highest sex ratio of 1176 females per 1000 males.
- Daman district has lowest sex ratio of 533 females per 1000 males.
- Serchhip district of Mizoram has highest literacy rate of 98.76 percent.
- Alirajpur of MP is the least literate district of India with figure of 37.22 percent only.
- North East Delhi has the highest density with figure of 37346 person per square kilometer.
- Dibang Valley has the least density of 1 person per sq. km.
|
Population |
1,210,854,977 (2011) / |
|
Density |
382 people per.sq.km |
|
Growth rate |
1.19% (2016) (96th) |
|
Birth rate |
19.3 births/1,000 population |
|
Death rate |
7.3 deaths/1,000 population |
|
Life expectancy |
68.89 years (2009 est.) |
|
• male |
67.46 years (2009 est.) |
|
• female |
72.61 years (2009 est.) |
|
Fertility rate |
2.2 children born/woman |
|
Infant mortality rate |
41 deaths/1,000 live births |
Population growth
|
Census year |
Population |
Change (%) |
|
1951 |
361,088,000 |
– |
|
1961 |
439,235,000 |
21.6 |
|
1971 |
548,160,000 |
24.8 |
|
1981 |
683,329,000 |
24.7 |
|
1991 |
846,387,888 |
23.9 |
|
2001 |
1,028,737,436 |
21.5 |
|
2011 |
1,210,726,932 |
17.7 |
Age structure
|
Age structure |
|
|
0–14 years |
28.6% (male 190,075,426/female 172,799,553) |
|
15–64 years |
63.6% (male 381,446,079/female 359,802,209) |
|
65 and over |
5.3% (male 29,364,920/female 32,591,030) |
Sex ratio
|
Sex ratio |
|
|
At birth |
1.10 male(s)/female (2013 est.) |
|
Under 15 |
1.10 male(s)/female (2009 est.) |
|
15–64 years |
1.06 male(s)/female (2009 est.) |
|
65 and over |
0.90 male(s)/female (2009 est.) |
Population distribution by states/union territories (2011)
|
Rank |
State |
Population |
% |
SexRatio |
Literacy |
Rural % |
Urban % |
Area(km²) |
Density |
DecadalGrowth% |
|
1 |
Uttar Pradesh |
199,812,341 |
16.5 |
930 |
67.68 |
78 |
22 |
240,928 |
828 |
20.10% |
|
2 |
Maharashtra |
112,374,333 |
9.28 |
929 |
82.34 |
55 |
45 |
307,713 |
365 |
16.00% |
|
3 |
Bihar |
104,099,452 |
8.6 |
918 |
61.8 |
89 |
11 |
94,163 |
1,102 |
25.10% |
|
4 |
West Bengal |
91,276,115 |
7.54 |
950 |
76.26 |
68 |
32 |
88,752 |
1,030 |
13.90% |
|
5 |
Andhra Pradesh |
84,580,777 |
6.99 |
993 |
67.02 |
67 |
33 |
275,045 |
308 |
10.98% |
|
6 |
Madhya Pradesh |
72,626,809 |
6 |
931 |
69.32 |
72 |
28 |
308,245 |
236 |
20.30% |
|
7 |
Tamil Nadu |
72,147,030 |
5.96 |
996 |
80.09 |
52 |
48 |
130,058 |
555 |
15.60% |
|
8 |
Rajasthan |
68,548,437 |
5.66 |
928 |
66.11 |
75 |
25 |
342,239 |
201 |
21.40% |
|
9 |
Karnataka |
61,095,297 |
5.05 |
973 |
75.36 |
61 |
39 |
191,791 |
319 |
15.70% |
|
10 |
Gujarat |
60,439,692 |
4.99 |
919 |
78.03 |
57 |
43 |
196,024 |
308 |
19.20% |
|
Rank |
State |
Population |
% of total |
SexRatio |
Literacy |
Rural % |
Urban % |
Area(km²) |
Density |
DecadalGrowth%(2001–11) |
|
11 |
Odisha |
41,974,218 |
3.47 |
979 |
72.87 |
83 |
17 |
155,707 |
269 |
14.00% |
|
12 |
Kerala |
33,406,061 |
2.76 |
1,084 |
94 |
52 |
48 |
38,863 |
859 |
4.90% |
|
13 |
Jharkhand |
32,988,134 |
2.72 |
948 |
66.41 |
76 |
24 |
79,714 |
414 |
22.30% |
|
14 |
Assam |
31,205,576 |
2.58 |
958 |
72.19 |
86 |
14 |
78,438 |
397 |
16.90% |
|
15 |
Punjab |
27,743,338 |
2.29 |
895 |
75.84 |
63 |
37 |
50,362 |
550 |
13.70% |
|
16 |
Chhattisgarh |
25,545,198 |
2.11 |
991 |
70.28 |
77 |
23 |
135,191 |
189 |
22.60% |
|
17 |
Haryana |
25,351,462 |
2.09 |
879 |
75.55 |
65 |
35 |
44,212 |
573 |
19.90% |
|
18 |
Delhi |
16,787,941 |
1.39 |
868 |
86.21 |
23 |
77 |
1,484 |
11,297 |
21% |
|
19 |
Jammu and Kashmir |
12,541,302 |
1.04 |
889 |
67.16 |
73 |
27 |
222,236 |
56 |
23.70% |
|
20 |
Uttarakhand |
10,086,292 |
0.83 |
963 |
79.63 |
69 |
31 |
53,483 |
189 |
19.20% |
|
Rank |
State |
Population |
% of total |
SexRatio |
Literacy |
Rural % |
Urban % |
Area(km²) |
Density |
DecadalGrowth%(2001–11) |
|
21 |
Himachal Pradesh |
6,864,602 |
0.57 |
972 |
82.8 |
90 |
10 |
55,673 |
123 |
12.80% |
|
22 |
Tripura |
3,673,917 |
0.3 |
960 |
87.22 |
74 |
26 |
10,486 |
350 |
14.70% |
|
23 |
Meghalaya |
2,966,889 |
0.25 |
989 |
74.43 |
80 |
20 |
22,429 |
132 |
27.80% |
|
24 |
Manipur |
2,721,756 |
0.21 |
992 |
79.21 |
70 |
30 |
22,327 |
122 |
18.70% |
|
25 |
Nagaland |
1,978,502 |
0.16 |
931 |
79.55 |
71 |
29 |
16,579 |
119 |
–0.5% |
|
26 |
Goa |
1,458,545 |
0.12 |
973 |
88.7 |
38 |
62 |
3,702 |
394 |
8.20% |
|
27 |
Arunachal Pradesh |
1,383,727 |
0.11 |
938 |
65.38 |
77 |
23 |
83,743 |
17 |
25.90% |
|
28 |
Puducherry |
1,247,953 |
0.1 |
1,037 |
85.85 |
32 |
68 |
479 |
2,598 |
27.70% |
|
Rank |
State |
Population |
% of total |
SexRatio |
Literacy |
Rural % |
Urban % |
Area(km²) |
Density |
DecadalGrowth%(2001–11) |
|
29 |
Mizoram |
1,097,206 |
0.09 |
976 |
91.33 |
49 |
51 |
21,081 |
52 |
22.80% |
|
30 |
Chandigarh |
1,055,450 |
0.09 |
818 |
86.05 |
3 |
97 |
114 |
9,252 |
17.10% |
|
31 |
Sikkim |
610,577 |
0.05 |
890 |
81.42 |
75 |
25 |
7,096 |
86 |
12.40% |
|
32 |
Andaman |
380,581 |
0.03 |
876 |
86.63 |
64 |
36 |
8,249 |
46 |
6.70% |
|
33 |
Dadra and N |
343,709 |
0.03 |
774 |
76.24 |
53 |
47 |
491 |
698 |
55.50% |
|
34 |
Daman and Diu |
243,247 |
0.02 |
618 |
87.1 |
25 |
75 |
112 |
2,169 |
53.50% |
|
35 |
Lakshadweep |
64,473 |
0.01 |
946 |
91.85 |
22 |
78 |
32 |
2,013 |
6.20% |
Infant mortality rate trend (deaths per 1000)
|
Year |
Male |
Female |
|
1998 |
70 |
74 |
|
2005 |
56 |
58 |
|
2009 |
49 |
52 |
|
Year |
Average population(x 1000) |
Crude birth rate (per 1000) |
Crude death rate(per 1000) |
Natural change(per 1000) |
|
1981 |
716,493 |
33.9 |
12.5 |
21.4 |
|
1991 |
891,910 |
29.3 |
9.8 |
19.5 |
|
2001 |
1,071,374 |
25.4 |
8.4 |
17 |
|
2011 |
1,197,658 |
21.8 |
7.1 |
14.7 |
|
2012 |
1,212,827 |
21.6 |
7 |
14.6 |
|
2013 |
1,227,012 |
21.4 |
7 |
14.4 |
|
2014 |
1,233,542 |
21 |
6.7 |
14.3 |
|
2015 |
1,259,108 |
20.8 |
6.5 |
14.3 |
|
2016 |
1,273,986 |
20.4 |
6.4 |
14 |
Census of India: sample registration system
Life expectancy
|
Period |
Life expectancy in Years |
Period |
Life expectancy in Years |
|
1950–1955 |
36.6 |
1985–1990 |
56.7 |
|
1955–1960 |
39.7 |
1990–1995 |
59.1 |
|
1960–1965 |
42.7 |
1995–2000 |
61.5 |
|
1965–1970 |
46.0 |
2000–2005 |
63.5 |
|
1970–1975 |
49.4 |
2005–2010 |
65.6 |
|
1975–1980 |
52.5 |
2010–2015 |
67.6 |
|
1980–1985 |
54.9 |
Source: UN World Population Prospects
|
Age group |
Male |
Female |
Percentage (%) |
|
0–4 |
51.98 |
48.02 |
9.32 |
|
5–9 |
52.23 |
47.77 |
10.48 |
|
10–14 |
52.31 |
47.69 |
10.96 |
|
15–19 |
53.09 |
46.91 |
9.95 |
|
20–24 |
51.68 |
48.32 |
9.20 |
|
25–29 |
50.63 |
49.37 |
8.38 |
|
30–34 |
50.41 |
49.59 |
7.32 |
|
35–39 |
50.41 |
49.59 |
7.03 |
|
40–44 |
51.83 |
48.17 |
5.98 |
|
45–49 |
51.57 |
48.43 |
5.15 |
|
Age group |
Male |
Female |
Percentage (%) |
|
50–54 |
52.67 |
47.33 |
4.05 |
|
55–59 |
49.70 |
50.30 |
3.23 |
|
60–64 |
49.65 |
50.35 |
3.11 |
|
65–69 |
48.93 |
51.07 |
2.18 |
|
70–74 |
50.25 |
49.75 |
1.59 |
|
75–79 |
48.64 |
51.36 |
0.76 |
|
80–84 |
47.06 |
52.94 |
0.51 |
|
85–89 |
47.00 |
53.00 |
0.20 |
|
90–94 |
45.11 |
54.89 |
0.12 |
|
95–99 |
46.54 |
53.46 |
0.05 |
|
100+ |
47.76 |
52.24 |
0.05 |
Structure of the population (09.02.2011) (Census)
|
Age group |
Male |
Female |
Total |
|
0–4 |
8.7 |
8.2 |
8.5 |
|
5–9 |
9.1 |
8.8 |
8.9 |
|
10–14 |
9.8 |
9.4 |
9.6 |
|
15–19 |
10.4 |
9.9 |
10.1 |
|
20–24 |
10.2 |
10.7 |
10.4 |
|
25–29 |
9.5 |
9.8 |
9.7 |
|
30–34 |
8.1 |
8.0 |
8.1 |
|
35–39 |
7.0 |
7.2 |
7.1 |
|
40–44 |
6.1 |
6.1 |
6.1 |
|
45–49 |
5.3 |
5.4 |
5.3 |
Population pyramid 2016 (estimates)
|
Age group |
Male |
Female |
Total |
|
50–54 |
4.4 |
4.3 |
4.3 |
|
55–59 |
3.5 |
3.7 |
3.6 |
|
60–64 |
3.0 |
3.1 |
3.1 |
|
65–69 |
2.1 |
2.2 |
2.2 |
|
70–74 |
1.4 |
1.5 |
1.5 |
|
75–79 |
0.8 |
0.9 |
0.9 |
|
80–84 |
0.4 |
0.5 |
0.5 |
|
85+ |
0.2 |
0.3 |
0.3 |
|
0–14 |
27.6 |
26.4 |
27.0 |
|
15–64 |
67.5 |
68.2 |
67.8 |
|
65+ |
4.9 |
5.4 |
5.4 |
|
Year |
CBR – Total |
TFR – Total |
CBR – Urban |
TFR – Urban |
CBR – Rural |
TFR – Rural |
|
1992–1993 |
28.7 |
3.39 (2.64) |
24.1 |
2.70 (2.09) |
30.4 |
3.67 (2.86) |
|
1998–1999 |
24.8 |
2.85 (2.13) |
20.9 |
2.27 (1.73) |
26.2 |
3.07 (2.28) |
|
2005–2006 |
23.1 |
2.68 (1.90) |
18.8 |
2.06 (1.60) |
25.0 |
2.98 (2.10) |
|
2015–2016 |
19.0 |
2.18 (1.8) |
15.8 |
1.75 (1.5) |
20.7 |
2.41 (1.9) |
|
|
CBR = crude birth rate (per 1000); TFR = total fertility rate (number of children per woman). 1Number in parenthesis represents the wanted fertility rate
Crude birth rate and total fertility rate (wanted fertility rate)
|
Religion |
Population |
Percent (%) |
|
All |
1,210,854,977 |
100.00 |
|
Hindus |
966,378,868 |
79.80 |
|
Muslims |
172,245,158 |
14.23 |
|
Christians |
27,819,588 |
2.30 |
|
Sikhs |
20,833,116 |
1.72 |
|
Buddhists |
8,442,972 |
0.70 |
|
Jains |
4,451,753 |
0.37 |
|
Others |
7,937,734 |
0.66 |
|
Not stated |
2,867,303 |
0.24 |
Religious Demographics
|
Religious group |
Population % 1951 |
Population % 1961 |
Population % 1971 |
Population % 1981 |
Population % 1991 |
Population % 2001 |
Population % 2011 |
|
Hinduism |
84.1% |
83.45% |
82.73% |
82.30% |
81.53% |
80.46% |
79.80% |
|
Islam |
9.8% |
10.69% |
11.21% |
11.75% |
12.61% |
13.43% |
14.23% |
|
Christianity |
2.3% |
2.44% |
2.60% |
2.44% |
2.32% |
2.34% |
2.30% |
|
Sikhism |
1.79% |
1.79% |
1.89% |
1.92% |
1.94% |
1.87% |
1.72% |
|
Buddhism |
0.74% |
0.74% |
0.70% |
0.70% |
0.77% |
0.77% |
0.70% |
|
Jainism |
0.46% |
0.46% |
0.48% |
0.47% |
0.40% |
0.41% |
0.37% |
|
Zoroastrianism |
0.13% |
0.09% |
0.09% |
0.09% |
0.08% |
0.06% |
n/a |
|
Others |
0.43% |
0.43% |
0.41% |
0.42% |
0.44% |
0.72% |
0.9% |
Linguistic demographics
|
Rank |
Language |
Speakers |
Percentage (%) |
|
1 |
Hindi |
422,048,642 |
41.030 |
|
2 |
Bengali |
83,369,769 |
8.110 |
|
3 |
Telugu |
74,002,856 |
7.190 |
|
4 |
Marathi |
71,936,894 |
6.990 |
|
5 |
Tamil |
60,793,814 |
5.910 |
|
6 |
Urdu |
51,536,111 |
5.010 |
|
7 |
Gujarati |
46,091,617 |
4.480 |
|
8 |
Kannada |
37,924,011 |
3.690 |
|
9 |
Malayalam |
33,066,392 |
3.210 |
|
10 |
Odia |
33,017,446 |
3.210 |
STATE WISE GENERAL INFORMATION
|
Most populated |
Population |
Least populated |
Population |
||
|
1 |
Uttar Pradesh |
199,281,477 |
1 |
Sikkim |
607,688 |
|
2 |
Maharashtra |
112,372,972 |
2 |
Mizoram |
1,091,014 |
|
3 |
Bihar |
103,804,637 |
3 |
Arunachal Pradesh |
1,382,611 |
|
4 |
West Bengal |
91,347,736 |
4 |
Goa |
1,457,723 |
|
5 |
Madhya Pradesh |
72,597,565 |
5 |
Nagaland |
1,980,602 |
Population of India by state (UTs not included)
|
Highest |
Density |
Least |
Density |
||
|
1 |
Bihar |
1102 |
1 |
Arunachal Pradesh |
17 |
|
2 |
West Bengal |
1029 |
2 |
Mizoram |
52 |
|
3 |
Kerala |
859 |
3 |
Sikkim |
86 |
|
4 |
Uttar Pradesh |
828 |
4 |
Nagaland |
119 |
|
5 |
Haryana |
573 |
5 |
Manipur |
122 |
Population density (persons per sq. km) by state (UTs not included)
|
Highest |
Rate (%) |
Least |
Rate (%) |
||
|
1 |
Kerala |
93.91 |
1 |
Bihar |
63.82 |
|
2 |
Lakshadweep |
92.28 |
2 |
Telangana |
66.5 |
|
3 |
Mizoram |
91.58 |
3 |
Arunachal Pradesh |
66.95 |
|
4 |
Tripura |
87.75 |
4 |
Rajasthan |
67.06 |
|
5 |
Goa |
87.4 |
5 |
Andhra Pradesh |
67.4 |
Literacy Rates in India
Total Literacy Rate: 74.04%
Male Literacy Rate: 82.14%
Female Literacy Rate: 65.46%
|
Top Three |
Rate |
Bottom Three |
Rate |
||
|
1 |
Sikkim |
1.2 |
1 |
Bihar |
3.4 |
|
2 |
Andaman & Nicobar Islands |
1.5 |
2 |
Meghalaya |
3 |
|
3 |
Punjab, Kerala, Chandigarh |
1.6 |
3 |
Uttar Pradesh, Nagaland |
2.7 |
Fertility Rate in India (Number of children born per woman)
Total fertility rate: 2.2
|
Top Three |
Sex Ratio |
Bottom Three |
Sex Ratio |
||
|
1 |
Kerala |
1084 |
1 |
Delhi |
868 |
|
2 |
Tamil Nadu |
996 |
2 |
Haryana |
879 |
|
3 |
Andhra Pradesh |
993 |
3 |
Jammu & Kashmir |
889 |
|
4 |
Chhattisgarh |
991 |
4 |
Sikkim |
890 |
|
5 |
Meghalaya |
989 |
5 |
Punjab |
895 |
Sex Ratio in India (not including UTs)
Total sex ratio in India: 940
(940 females per 1000 males)
DISTRICT WISE GENERAL INFORMATION
Highest Population (2011)
1. Thane (Maharashtra)—(1,10,60, 148)
2. North Chobis Pargana (West Bengal) — (1,00,09, 781)
3. Bengaluru (Kamataka)— 9888910
4. Pune (Maharashtra)—(94,29,408)
5. Mumbai Sub—Urban (Maharashtra)—(9 3,56,962)
Lowest Population (2011)
1. Dibang Valley (Arunachal Pradesh)-(8,004)
2. Anjaw(ArunachalPradesh)—(21,167)
3. Lahul—Spiti (HimachalPradesh)—(3 1,564)
4. Upper Siang (Arunachal Pradesh)-(3 5,3 20)
5. Nicobars (A & N)—(36,842)
Highest Sex Ratio (2011)
1. Mahe(Puducherry)-1 184
2. Aim ora (Uttarakhand)— 1139
3. Kannur (Kerala)—1 136
4. Pathanamthitta—1 132
5. Ratnagiri (Maharashtra)—1 122
Lowest Sex Ratio (2011)
1. Daman (Daman & Diu)-5 34
2. Leh (Jammu & Kashmir)-690
3. Tawang (Arunachal Pradesh)—7 14
4. North Distt. (Sikkim)—767
5. Nicobars—777
Religious Population-2011
1. Hindu—90.63 crores (79.8%)
2. Muslim—17.22 crores (14.2%)
3. Christian—2.78 crores (2.3%)
4. Sikh—2.08 crores (1.7%)
5. Buddhist—0.84 crores (0.7%)
6. Jain—O.45 crores (0.4%)
7. Others—O.79 crores (0.7%)
8. No Religion-0.29 crore (0.2%)
Urbanisation in India
- we need to know which places fell under the category of cities and UA category.
- All places which had a municipality, a corporation, notified town area community or a cantonment board was known to fall under the category of city or UA.
- Also these places were chosen under the category as all of them had a population over 5000 and more than 75% of the male population was found to be engaged in non-agricultural working sectors.
- The basic city population in India had seen a good amount of growth due to urbanization and raised literacy levels.
- It was calculated that in the year 2011, there are 4041 statutory towns, 3894 census towns, 475 UAs and 981 outgrowths from a number that was 3799 for statutory towns, 1362 for census towns, 384 UAs and 962 outgrowths.
- So there was an increase in every one of the places.
Fast Facts: Urbanization Scenario in India
According to Census 2011,
- Total Urban Population: 377 million
- Level of Urbanization/ Percentage of Urban Population: 31.1%
- Rate of growth of urban population: 2.76% per annum during 2001-2011.
- Most Urbanized state: Goa (62%), Mizoram, Tamil Nadu. Delhi (97.5%) most urbanized among the UTs
- Least Urbanized state: Himachal Pradesh (10%) followed by Bihar, Assam and Odhisa
- Number of urban agglomerations/towns: 5161
- Urbanization – 1961 17.97%
- Urbanization – 1971 19.91%
- Urbanization – 1981 23.34%
- Urbanization – 1991 25.71%
|
Rank |
State |
Total Population |
Urban Pop (%) |
Rural Pop (%) |
|
1 |
Delhi |
16,787,941 |
97.50 |
2.50 |
|
2 |
Chandigarh |
1,055,450 |
97.25 |
2.75 |
|
3 |
Lakshadweep |
64,473 |
78.07 |
21.93 |
|
4 |
Daman and Diu |
243,247 |
75.17 |
24.83 |
|
5 |
Puducherry |
1,247,953 |
68.33 |
31.67 |
|
6 |
Goa |
1,458,545 |
62.17 |
37.83 |
|
7 |
Mizoram |
1,097,206 |
52.11 |
47.89 |
|
8 |
Tamil Nadu |
72,147,030 |
48.40 |
51.60 |
|
9 |
Kerala |
33,406,061 |
47.70 |
52.30 |
|
10 |
Dadra and Nagar Haveli |
343,709 |
46.72 |
53.28 |
2011
TOP
|
Rank |
State |
Total Population |
Urban Pop (%) |
Rural Pop (%) |
|
1 |
HP |
6,864,602 |
10.03 |
89.97 |
|
2 |
Bihar |
104,099,452 |
11.29 |
88.71 |
|
3 |
Assam |
31,205,576 |
14.10 |
85.90 |
|
4 |
Orissa |
41,974,218 |
16.69 |
83.31 |
|
5 |
2,966,889 |
20.07 |
79.93 |
|
|
6 |
199,812,341 |
22.27 |
77.73 |
|
|
7 |
1,383,727 |
22.94 |
77.06 |
|
|
8 |
25,545,198 |
23.24 |
76.76 |
|
|
9 |
32,988,134 |
24.05 |
75.95 |
|
|
10 |
68,548,437 |
24.87 |
75.13 |
2011
LOW
|
Rank |
City |
Pop. |
|
1 |
Mumbai |
12,478,447 |
|
2 |
Delhi |
11,007,835 |
|
3 |
Bangalore |
8,425,970 |
|
4 |
Hyderabad |
6,809,970 |
|
5 |
Ahmedabad |
5,570,585 |
|
6 |
Chennai |
4,681,087 |
|
7 |
Kolkata |
4,486,679 |
|
8 |
Surat |
4,462,002 |
|
9 |
Pune |
3,115,431 |
|
10 |
Jaipur |
3,073,350 |
|
Rank |
City |
Pop. |
|
11 |
Kanpur |
2,920,067 |
|
12 |
Lucknow |
2,901,474 |
|
13 |
Nagpur |
2,405,421 |
|
14 |
Indore |
1,960 521 |
|
15 |
Thane |
1,818,872 |
|
16 |
Bhopal |
1,795,648 |
|
17 |
Visakhapatnam |
1,730,320 |
|
18 |
Pimpri-Chinchwad |
1,729,359 |
|
19 |
Patna |
1,683,200 |
|
20 |
Ludhiana |
1,613,878 |
ST/SC in India
ST
- There are about 550 tribes in India. As per 1951 census, 5.6% of the total population of the country was tribal.
- According to Census-2011, the number of scheduled tribes in India is 10, 42, 81,034. It is 8.6% of the total population of India.
- A total of 9, 38, 19,162 people belonging to scheduled tribes reside in rural areas whereas 1, 04, 61,872 people in urban areas.
- The scheduled tribes are 11.3% of the total population of rural areas and 2.8% of urban areas.
- During 2001-2011 the decadal growth rate of the population of India was 17.64%. During this period the decadal growth rate of the scheduled tribes was 23.7%.
- The decadal growth rate of the scheduled tribes in rural areas was less (21.3%) whereas it was more (49.7%) in urban areas.
Most ST% Least ST%
1. Lakshadweep (94.51%) 1. Goa (0.04%)
2. Mizoram (94.46%) 2. Uttar Pradesh (0.04%)
3. Nagaland (89.15%) 3. Tamil Nadu (1.04%)
4. Meghalaya (85.94%) 4. Kerala (1.14%)
State-wise Total Population of Scheduled Tribes (in descending order)
|
State |
Population of Scheduled Tribes (in lakh) |
% |
|
MP |
152.3 |
14.70% |
|
Maharashtra |
105.3 |
10.10% |
|
Odisha |
95.9 |
9.20% |
|
Rajasthan |
92.8 |
8.90% |
|
Gujarat |
89.6 |
8.60% |
|
Jharkhand |
86.5 |
8.30% |
|
Chhattisgarh |
78.2 |
7.50% |
Literacy of Scheduled Tribes
As per Census 2011, the rate of literacy in India is 72.99% whereas that of it in scheduled tribes is 59%. State-wise, the rate of literacy in scheduled tribes is highest in Mizoram (91.7%) and lowest in Andhra Pradesh (49.2%). Among union territories, the highest rate of literacy in scheduled tribes is in Lakshadweep (91.7%).
Sex Ratio Scheduled Tribes
As per Census 2011, the sex ratio in India is 943 whereas it is 990 in scheduled tribes. The sex ratio of children (0-6 age group) in India is 919 whereas that of it are 957 in scheduled tribes. The sex ratio in scheduled tribes is in favour of females in Goa (1046), Kerala (1025), Arunachal Pradesh (1032), Odisha (1029) and Chhattisgarh (1020). In Jammu and Kashmir (924) the sex ratio in scheduled tribes is the lowest in the country.
|
State |
Major Tribes |
|
Arunachal Pradesh |
Aptani, Mishmi, Daffla, Miri, Aka, Sinpho, Khamti etc. |
|
Assam |
Chakma, Mikir, Kachari, Bora etc |
|
Meghalaya |
Garo, Khasi, Jaintia, Hamar etc |
|
Nagaland |
Angami, Siteng, Serna, Konyak, Lotha etc |
|
Manipur |
Kuki, Lepcha, Mugh etc |
|
Tripura |
Bhutia, Chakma, Garo, Kuki etc |
|
Mizoram |
Mizo, Lakher etc |
|
Jharkhand |
Santhal, Paharia, Munda, Ho, Birhor, Oraon, Kharia, Tamaria etc |
|
West Bengal |
Asur, Bhumij, Birhor, Lodha, Lepcha, Magh, Mahali, Malpaharia, Polia etc |
|
State |
Major Tribes |
|
UP & Uttarakhand |
Tharu, Bhatia, Jaunsari, Bhoksha, Raji, Khasa, Bhuia, Kharwar, Manjhi, Kol etc |
|
Odisha |
Zuang, Sawara, Karia, Khond, Kandh etc |
|
MP and Chhattisgarh |
Hill Maria, Muria, Dandami, Gond, Baiga. Parja, Bhattra, Agaria, Bhil, Saharia. Korwa, Halba |
|
Himachal Pradesh |
Gaddi, Gujjar, Kinnar etc |
|
Jammu & Kashmir |
Gaddi, Bakarwal etc |
|
Rajasthan |
Bhil, Meena. Kathoria, Garasia etc |
|
AnPr. and Telangana |
Chenchu, Yandai, Kurumba, Khond, Bagdaz, Koya, Bagata, Gadaba etc |
|
Kerala |
Irula, Kurumba, Kadar, Puliyan etc |
|
Tamil Nadu |
Toda, Kota, Kurumba, Badaga etc |
|
Andaman & Nicobar |
Great Andamanese, Nicobarese, Onge, Jarawa, Shompen, Sentenalese etc. |
SC
Most SC% of Population Least SC% of Population
1. Punjab (28.85%) 1. Mizoram (0.03%)
2. Himanchal Pradesh (24.72%) 2. Arunachal Pradesh (0.5″6%)
3. West Bengal (23.02%) 3. Goa (1.77%)
4. Uttar Pradesh (21.18%) 4. Dadar & Nagar Haveli (1.58%)
- As per Census- 2011, the number of scheduled castes in India is 16.6% of the total population of India.
- A total of 15, 38, 50,562 people belonging to the scheduled castes reside in rural areas.
- 4, 75, 27,524 people in urban areas.
- The scheduled castes are 18.5% of the total population of rural areas and 12.6% of urban areas.
- It is to be noted that during 2001-2011 the decadal growth rate of the population of India was 17.64%.
- During this period decadal growth rate of the scheduled castes was 20.8%.
- The decadal growth rate of the scheduled castes in rural areas was less (15.7%)
- whereas it was more (41.3%) in urban areas because of their migration from villages to towns and cities.
- States having maximum ratio of scheduled castes, as per Census- 2011 (in descending order) – Punjab (31.9%) > Himachal Pradesh (25.2%) > West Bengal (23.5%) >Uttar Pradesh (20.7%) > Haryana (20.2%)
- States and Union territories having minimum ratio of Scheduled Castes, as per Census-2011 (in ascending order) – Mizoram (0.1%) < Meghalaya (0.6%) < Goa (1.7%) < Dadra and Nagar Haveli (1.8%) < Daman and Diu (2.5%)
|
State |
in lakh |
% |
|
Uttar Pradesh |
412.80 |
20.5% |
|
West Bengal |
215.40 |
10.7% |
|
Bihar |
170.05 |
8.2% |
|
Tamil Nadu |
144.99 |
7.2% |
|
Andhra Pradesh |
138.95 |
6.9% |
|
Maharashtra |
132.90 |
6.6% |
Sex Ratio in Scheduled Castes
As per Census 2011, the sex ratio in India is 943 whereas it is 945 in scheduled Castes. The sex ratio of children (0-6 age group) in India is 919 whereas it is 933 in scheduled castes. The sex ratio in scheduled castes is in favour of females in Kerala (1057), Puducherry (1056), Goa (1015), Arunachal Pradesh (1008) and Tamil Nadu (1004). Mizoram is the only state where the sex ratio in scheduled castes is not only lowest (509) in the country but deplorable also.
Literacy in Scheduled Castes
As per Census 2011, the rate of literacy in India is 72.99% whereas that of it in scheduled castes is 66.1 %. State wise, the rate of literacy in scheduled castes is highest in Mizoram (92.4%) and lowest in Bihar (48.6%). Among union territories, the highest rate of literacy in scheduled castes is in Daman and Diu (92.6%). According to the Constitution (Scheduled Castes) Orders (Amendment) Act, 1990 Scheduled Castes can only belong to Hindu, Sikh or Buddhist religions.
UPSC_Pre_MCQ
As per the 1991 Census, which one of the following states has a lower population density than the other three?[1996] (a)Sikkim (b)Nagaland (c)Meghalaya (d)Manipur
Ans.(a)Ranking of States and Union territories by density in 1991 : Sikkim57 Nagaland73 Meghalaya79 Manipur82
In the Indian context the term ‘De-notified tribes’ refers to :[1996] (a)tribes which are aboriginals (b)nomadic tribes (c)tribes practising shifting cultivation (d)tribes which were earlier classified as criminal tribes
Ans.(d)Denotified tribe in India refers to the tribes who where originally listed under the originally trible act of 1871. They are also known as Vimukta Jati.
The tribal population in Andaman and Nicobar islands belongs to the:[1997] (a)Australoid race (b)Caucasoid race (c)Mongoloid race (d)Negroid race
Ans The tribal population of Andaman and Nicobar belong to Negroid race. A small population of Shompen and Nicobars are Mongoloid descent.
Some people in Manipur live in house built on floating islands of weeds and decaying vegetation held together by suspended silt. These are called:[1998] (a)Tipis (b)Barkhans (c)Phoomdis(d)Izba
Ans Some people in Manipur live in house built on floating Islands of weeds and decaying vegetation held together by suspended silt. These islands are called “Phoomdis”.
Assertion (A ) : According to statistics, more female children are born each year than male children in India. Reason (R) : In India, the death rate of a male child is higher than that of the female child. [1999]
Both A and R are true and R is the correct explanation of A (b)Both A and R are true but R is not a correct explanation of A (c)A is true but R is false (d)A is false but R is true
Ans.(c)Assertion is correct, but the reason is wrong. In India, the sex ratio of female is lower than male, because female foeticide is common across India.
Which one of the following pairs of states and tribes is not correctly matched?[1999] (a)Assam:Miri (b)Nagaland:Konyak (c)Arunachal:Apatani (d)Madhya Pradesh:Lambada
Ans.(d)Lambada tribes are found in Rajasthan and not in Madhya Pradesh.
Which one of the following pairs of primitive tribes and places of their inhabitation is NOT correctly matched? (a)Buksa:Pauri-Garhwal (b)Kol:Jabalpur (c)Munda:Chhota Nagpur (d)Korba:Kodagu
Ans.(d)Korba tribe in found in chhotanagpur of Chhattisgarh and Jarkhand, whereas Kodagu in a district in Karnataka.
Which one of the following statements is true according to 1991 Census data?[2000] (a)U.P. has the highest density of population in India (b)Himachal Pradesh has the highest female to male sex ratio in India (c)West Bengal has the highest growth rate of population in India (d)Bihar has the lowest literacy rate in India
Ans.(d)According to 1991 census data, Bihar had the lowest rate of literacy at 47.53%.
Assertion (A) : Ganga plain is the most densely populated part of India. Reason (R) : Ganga is the most harnessed river of India.[2000] (a)Both A and R are true and R is the correct explanation of A (b)Both A and R are true but R is not a correct explanation of A (c)A is true but R is false (d)A is false but R is true
Ans.(b)The Ganga plain is most important plain of India. The gangetic plain covers more than a fourth of the country’s total surface. The alluvial fertile soil is very suitable for cultivation of different cereals, pulses and nuts. So bulk of the population resides in this plain area.
India’s population growth during the 20th century can be classified into four distinct phases. Match List-I (Period) with List-II (Phase) and select the correct answer using the codes given below the lists:[2002] List-I (Period)List-II (Phase) A.1901-19211.Steady growth B.1921 -19512.Rapid high growth C.1951-19813.Stagnant growth D.1981 -20014.High growth with definite signs of slowdown Codes : (a)A-3; B-1; C-4; D-2 (b)A-1; B-3; C-2; D-4 (c)A-3; B-1; C-2; D-4 (d)A-1; B-3; C-4; D-2
Ans. (c)
Which amongst the following States has the highest population density as per Census-2001 ?[2003] (a)Kerala (b)Madhya Pradesh (c)Uttar Pradesh (d)West Bengal
Ans.(d)As per the census 2001, West Bengal has the highest population density of 904, Kerala has 819, Madhya Pradesh has 196 and Uttar Pradesh has 689.
In which one of the following Union Territories, do people of the Onge tribe live?[2004] (a)Andaman and Nicobar Islands (b)Dadra and Nagar Haveli (c)Daman and Diu (d)Lakshadweep
Ans.(a)Onge is the major tribes of the union territory of Andaman and Nicobar. They were fully dependent on hunting and gathering. They belong to the Negrito race.
Which one of the following statements is not correct? [2005] (a)There is no definition of the Scheduled Tribe in the constitutions of India. (b)North-East India accounts for a little over half of the country’s tribal population. (c)The people known as Todas live in the Nilgiri area. (d)Lotha is a language spoken in Nagaland.
Ans.(b)Bulk of the tribal population is found in 5 states, i.e., Madhaya Pradesh, Maharashtra, Orissa, Gujarat and Bihar.
Consider the following statements: [2005] 1.India is the second country in the world to adopt a National Family Planning Programme. 2.The National Population Policy of India 2000 seeks to achieve replacement level of fertility by 2010 with a population of 111 crores. 3.Kerala is the first state in India to achieve replacement level of fertility. Which of the statements given above is/are correct? (a)1 only (b)1 and 2 (c)2 and 3 (d)1, 2 and 3
Ans.(c)Family Planning programme was started in 1952 by Government of India. Kerala is the first state in India to achieve replacement level of fertility.
Which one of the following statements is true on the basis of Census – 200l? [2005] (a)Bihar has the highest percentage of the scheduled castes of its population. (b)The decadal growth of population of India (1991-2001) has been below 20%. (c)Mizoram is the India state with the least population. (d)Pondicherry has the highest sex ratio among the Union Territories.
Ans.(d)Pondicherry, a Union Territory, has the sex ratio of 1001. Chandigarh has 777, Delhi has 861, Daman and Diu has 710, Dadra and Nagar Haveli has 812.
Which one among the following States of India has the lowest density of population? [2007] (a)Himachal Pradesh (b)Meghalaya (c)Arunachal Pradesh (d)Sikkim
Ans.(c)Population density of Arunachal Pradesh is 13, Himachal Pradesh is 109, Meghalaya is 103, and Sikkim is 76.
As per India’s National Population Policy, 2000, by which one of the following years is it our long-term objective to achieve population stabilization? [2008] (a)2025 (b)2035 (c)2045 (d)2055
Ans.(c)As per India’s National Population Policy – 2000, by 2045 India will achieve population stability which means that the size of population will not go up.
What is the approximate percentage of persons above 65 years of age in India’s current population?[2008] (a)14-15% (b)11-12% (c)8-9% (d)5-6%
Ans.(c)The correct answer is ©
Amongst the following States, which one has the highest percentage of rural population to its total population (on the basis of the Census, 2001)? [2008] (a)Himachal Pradesh (b)Bihar (c)Orissa (d)Uttar Pradesh
Ans.(a)On the basis of 2001 census, 9.8% of population Himachal Pradesh, 10.5% of population of Bihar, 15% of population of Orissa & 20.8 % of population of Uttar Pradesh live in rural areas.
Among the following, which one has the minimum population on the basis of data of Census of India, 2001? [2008] (a)Chandigarh (b)Mizoram (c)Pondicherry (d)Sikkim
Ans.(d)Population of Sikkim is 54,0851. Population of Chandigarh is 901,000, Population of Pondicherry is 974000 and population of Mizoram is 889,000.
Which of the following are among the million-plus cities in India on the basis of data of the Census, 2001? 1.Ludhiana 2.Kochi[2008] 3.Surat 4.Nagpur Select the correct answer using the code given below: Code: (a)1, 2 and 3 only (b)2, 3 and 4 only (c)1 and 4 only (d)1, 2, 3 and 4
Ans.(d)According to the Census of 2001 of India, the population of Ludhiana is 1,398,467, Surat is 2,433,835 and Nagpur is 2,052,066.
Consider the following statements: [2009] 1.Infant mortality rate takes into account the death of infants within a month after birth. 2.Infant mortality rate is the number of infant deaths in a particular year per 100 live births during that year. Which of the above statements is/are correct? (a)1 only (b)2 only (c)Both 1 and 2 (d)Neither 1 nor 2
Consider the following statements:[2009] 1.Between Census 1951 and Census 2001, the density of the population of India has increased more than three times. 2.Between Census 1951 and Census 2001, the annual growth rate (exponential) of the population of India has doubled. Which of the statements given above is/are correct? (a)1 only (b)2 only (c)Both 1 and 2 (d)Neither 1 nor 2
Ans.(d)The rate of population density increase in India is as follows: Density 1951 – 117 per sq km, 2001 – 324 per sq km; Annual growth rate in population density : 1951 – 1.25%, 2001 – 1.93%
With reference to ‘Changpa’ community of India, consider the following statements :[2014 – I] 1.They live mainly in the State of Uttarakhand. 2.They rear the Pashmina goats that yield a fine wool. 3.They are kept in the category of Scheduled Tribes. Which of the statements given above is/are correct? (a)1 only (b)2 and 3 only (c)3 only (d)1, 2 and 3
Ans.(b) The Changpa are a semi-nomadic Tibetan ethnic group found mainly in Zanskar region of Jammu and Kashmir. They rear the Pashmina goats that yield a fine wool. They are kept inthe category of Scheduled Tribes.
.