Course Title: Advanced Remote Sensing in Policy Making
Dr. Zubairul Islam
Professor
GIS & Remote Sensing
zubairul@gmail.com
WhatsApp No. +91-9821405543
Course Description
This advanced course is designed for senior professionals with no prior background in remote sensing who seek to leverage the power of remote sensing technologies in policy making. Remote sensing plays a pivotal role in shaping informed decisions across various sectors, from environmental conservation to socio-economic development. This course will provide participants with a comprehensive understanding of remote sensing principles, applications, and its integration into policy formulation and implementation. Through a combination of theoretical lessons, case studies, and hands-on exercises, participants will gain the knowledge and skills required to harness remote sensing data for effective policy-making.
Course Content
Chapter 1: Introduction to Remote Sensing and Policy Making
1.1 Fundamentals of Remote Sensing
1.2 Remote sensing and its role in policy making
VIDEO LECTURE
Chapter Two: Electromagnetic energy and Satellite images characteristics
2.1 Electromagnetic Radiation
2.2 The Electromagnetic Spectrum
2.3 Energy Interactions with the Earth’s surface
2.4 Satellite image characteristics
VIDEO LECTURE
Chapter 3: Environmental monitoring and conservation policies using Remote Sensing Techniques
3.1 Land use/land cover
MAP APPLICATION – LAND USE & LAND COVER
GEE APPLICATION – VEGETATION CHANGE
3.2 Climate
GEE APPLICATION -RAINFALL
GEE APPLICATION -TEMPERATURE
Chapter 4: Applications of Remote Sensing in assessment of Socio-economic development
4.1 Human Population and Settlements
GEE APPLICATION -POPULATION CHANGE
4.2 Human Development
GEE APPLICATION -NIGHT LIGHT DATA
Chapter 5: Integrating Remote Sensing into Policy Making
5.1 Role of remote sensing in evidence-based decision making
5.2 Data integration and fusion: combining remote sensing data with ground-based data
53 Designing effective policy strategies by incorporating remote sensing insights
1.1 Fundamentals of Remote Sensing.
Definition of Remote Sensing
Remote sensing is the science and art of acquiring information about the Earth’s surface and atmosphere from a distance, typically using sensors on aircraft or satellites. It involves the measurement and interpretation of electromagnetic radiation reflected or emitted by objects and areas on the Earth’s surface. Remote sensing provides valuable data for a wide range of applications, including environmental monitoring, resource management, disaster assessment, and scientific research.
Elements of Remote Sensing
There are seven elements that comprise the remote sensing process from beginning to end (Figure 1).
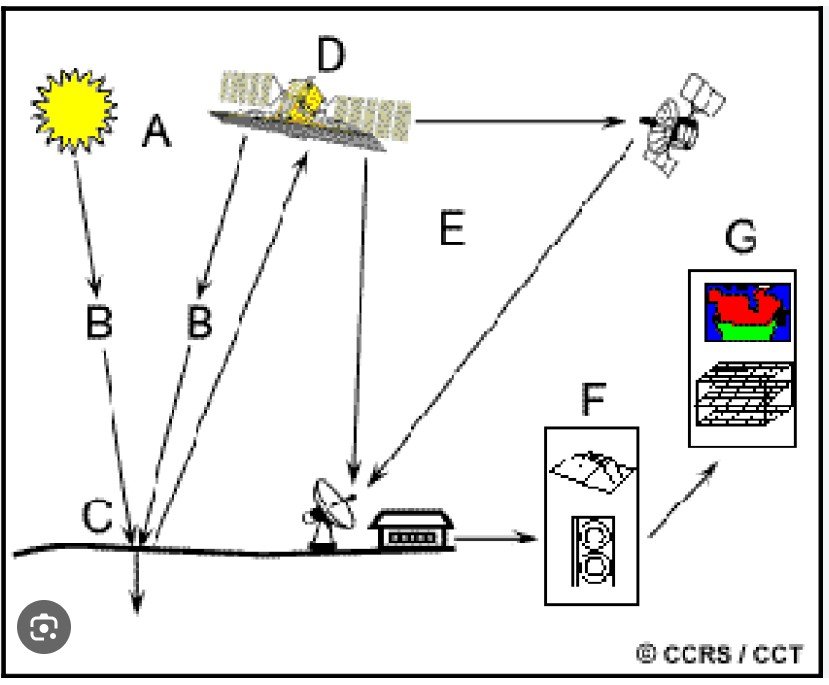
- Energy Source or Illumination (A) – The first requirement for remote sensing is to have an energy source that illuminates or provides electromagnetic energy to the target of interest.
- Radiation and the Atmosphere (B) – As the energy travels from its source to the target, it will come in contact with and interact with the atmosphere it passes through.
- Interaction with the Target (C) – Once the energy makes its way to the target through the atmosphere, it interacts with the target depending on the properties of both the target and the radiation.
- Recording of Energy by the Sensor (D) – After the energy has been scattered by, or emitted from the target, we require a sensor (remote – not in contact with the target) to collect and record the electromagnetic radiation.
- Transmission, Reception, and Processing (E) – The energy recorded by the sensor has to be transmitted, often in electronic form, to a receiving and processing station where the data are processed into an image (hardcopy and/or digital).
- Interpretation and Analysis (F) – the processed image is interpreted, visually and/or digitally or electronically, to extract information about the target which was illuminated.
- Application (G) – The final element of the remote sensing process is achieved when we apply the information, we have been able to extract from the imagery about the target in order to better understand it, reveal some new information, or assist in solving a particular problem.
1.2 Remote sensing and its role in policy making.
Remote sensing plays a significant role in policy making across various domains by providing valuable spatial information and data-driven insights. It enhances the policy-making process by offering accurate, up-to-date, and comprehensive information about the Earth’s surface and its changes over time. Here’s how remote sensing contributes to policy making:
- Environmental Monitoring and Conservation:
- Remote sensing helps assess changes in ecosystems, such as deforestation, wetland loss, and habitat degradation.
- Policymakers use this information to formulate and implement conservation strategies, establish protected areas, and monitor adherence to environmental regulations.
- Urban Planning and Land Use Management:
- Remote sensing provides data on urban growth, infrastructure development, and changes in land use patterns.
- This information guides urban planning decisions, zoning regulations, transportation networks, and sustainable urban development.
- Agriculture and Food Security:
- Remote sensing monitors crop health, land productivity, and agricultural practices.
- Policymakers can develop targeted interventions, allocate resources, and formulate policies to enhance food security, manage irrigation, and promote sustainable agriculture.
- Natural Resource Management:
- Remote sensing aids in monitoring mineral extraction, water resources, and energy exploration.
- Policymakers use this data to make informed decisions about resource allocation, conservation, and sustainable management.
- Disaster Management and Response:
- Remote sensing assists in assessing the extent of natural disasters such as floods, wildfires, and earthquakes.
- Policy responses are informed by accurate damage assessment, evacuation planning, and post-disaster recovery strategies.
- Climate Change and Environmental Policies:
- Remote sensing helps track changes in sea levels, ice cover, and vegetation, contributing to climate change research.
- Policymakers use this data to formulate climate adaptation and mitigation strategies and assess the effectiveness of environmental policies.
- Health and Disease Monitoring:
- Remote sensing aids in tracking disease vectors, environmental pollutants, and disease outbreak patterns.
- Policymakers use this information to devise public health strategies, monitor disease spread, and allocate healthcare resources.
- Infrastructure and Transportation Planning:
- Remote sensing data informs decisions related to transportation networks, road conditions, and infrastructure development.
- Policymakers use this information to improve transportation systems, optimize routes, and plan for future infrastructure needs.
- Border and Maritime Surveillance:
- Remote sensing supports border security, maritime surveillance, and illegal activity detection.
- Policymakers use this data to enhance national security, prevent smuggling, and protect marine resources.
- Transboundary and International Agreements:
- Remote sensing data facilitates the assessment of cross-border environmental issues, such as transboundary pollution or shared water resources.
- Policymakers can negotiate international agreements based on accurate and objective information.
- Evidence-Based Decision Making:
- Remote sensing provides objective and reliable data, reducing reliance on anecdotal evidence.
- Policymakers can make well-informed decisions supported by scientific information, leading to more effective and targeted policies.
Overall, remote sensing empowers policymakers with timely and accurate information, enabling them to develop evidence-based policies, monitor their implementation, and assess their impact. It contributes to more sustainable and informed decision-making processes across diverse policy domains.
2.1 Electromagnetic Radiation
The first requirement for remote sensing is to have an energy source to illuminate the target (unless the sensed energy is being emitted by the target). This energy is in the form of electromagnetic radiation.
Two characteristics of electromagnetic radiation are particularly important for understanding remote sensing. These are the wavelength and frequency.
The wavelength is the length of one wave cycle, which can be measured as the distance between successive wave crests. Wavelength is usually represented by the Greek letter lambda (λ). Wavelength is measured in metres (m) or some factor of metres such as nanometres (nm, 10-9 metres), micrometres (μm, 10-6 metres) (μm, 10-6 metres) or centimetres (cm, 10-2 metres). Frequency refers to the number of cycles of a wave passing a fixed point per unit of time.
wavelength and frequency are inversely related to each other. The shorter the wavelength, the higher the frequency.
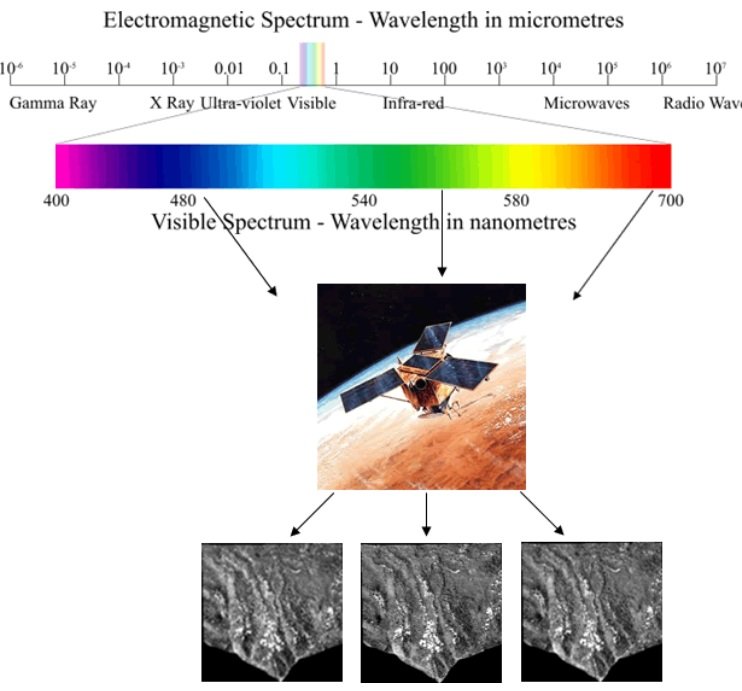
2.2 – The Electromagnetic Spectrum
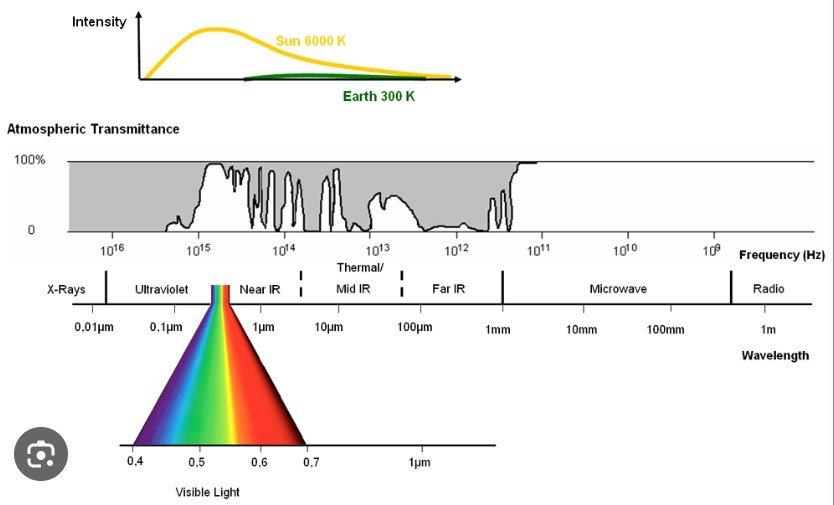
The electromagnetic (EM) spectrum is the continuous range of electromagnetic radiation, extending from gamma rays (highest frequency & shortest wavelength) to radio waves (lowest frequency & longest wavelength) and including visible light.
The EM spectrum can be divided into seven different regions —gamma rays, X-rays, ultraviolet, visible light, infrared, microwaves and radio waves.
Remote sensing involves the measurement of energy in many parts of the electromagnetic (EM) spectrum. The major regions of interest in satellite sensing are visible light, reflected and emitted infrared, and the microwave regions. The measurement of this radiation takes place in what are known as spectral bands. A spectral band is defined as a discrete interval of the EM spectrum. For example the wavelength range of 0.4μm to 0.5μm is one spectral band.
Satellite sensors have been designed to measure responses within particular spectral bands to enable the discrimination of the major Earth surface materials. Scientists will choose a particular spectral band for data collection depending on what they wish to examine.
The design of satellite sensors is based on the absorption characteristics of Earth surface materials across all the measurable parts in the EM spectrum.
Visible Spectrum
The light which our eyes – our “remote sensors” – can detect is part of the visible spectrum.
It is important to recognize how small the visible portion is relative to the rest of the spectrum.
There is a lot of radiation around us which is invisible to our eyes, but can be detected by other remote sensing instruments and used to our advantage.
It is important to note that this is the only portion of the EM spectrum we can associate with the concept of colors.
Blue, green, and red are the primary colors or wavelengths of the visible spectrum.
They are defined as such because no single primary color can be created from the other two, but all other colors can be formed by combining blue, green, and red in various proportions.
Although we see sunlight as a uniform or homogeneous color, it is actually composed of various wavelengths of radiation in primarily the ultraviolet, visible and infrared portions of the spectrum.
The visible portion of this radiation can be shown in its component colors when sunlight is passed through a prism.
Infrared (IR) Region
The IR Region covers the wavelength range from approximately 0.7 μm to 100 μm – more than 100 times as wide as the visible portion!
The IR region can be divided into two categories based on their radiation properties – the reflected IR, and the emitted or thermal IR.
Reflected and Thermal IR
Radiation in the reflected IR region is used for remote sensing purposes in ways very similar to radiation in the visible portion. The reflected IR covers wavelengths from approximately 0.7 μm to 3.0 μm.
The thermal IR region is quite different than the visible and reflected IR portions, as this energy is essentially the radiation that is emitted from the Earth’s surface in the form of heat. The thermal IR covers wavelengths from approximately 3.0 μm to 100 μm.
2.3 Energy Interactions with the Earth’s surface.
Radiation that is not absorbed or scattered in the atmosphere can reach and interact with the Earth’s surface. There are three (3) forms of interaction that can take place when energy strikes, or is incident (I) upon the surface.
These are: absorption (A); transmission (T); and reflection (R).
The total incident energy will interact with the surface in one or more of these three ways. The proportions of each will depend on the wavelength of the energy and the material and condition of the feature.
Absorption (A) occurs when radiation (energy) is absorbed into the target while transmission (T) occurs when radiation passes through a target. Reflection (R) occurs when radiation “bounces” off the target and is redirected. In remote sensing, we are most interested in
measuring the radiation reflected from targets. We refer to two types of reflection, which represent the two extreme ends of the way in which energy is reflected from a target: specular reflection and diffuse reflection.
Let’s take a look at a couple of examples of targets at the Earth’s surface and how energy at the visible and infrared wavelengths interacts with them.
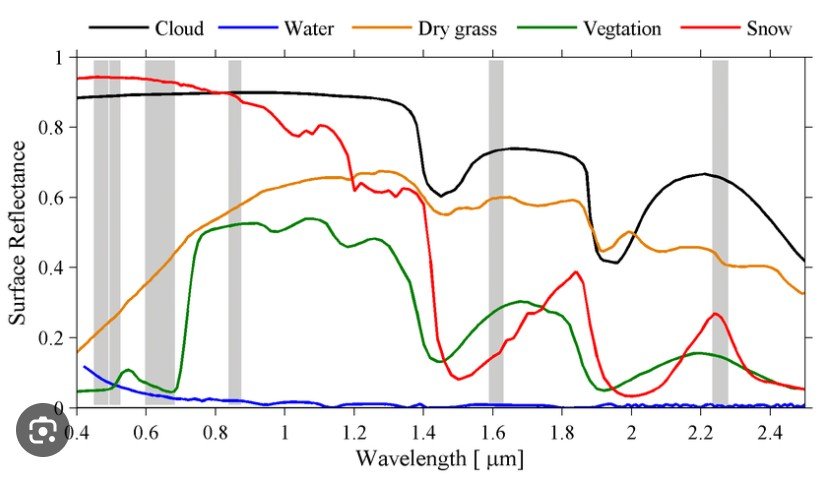
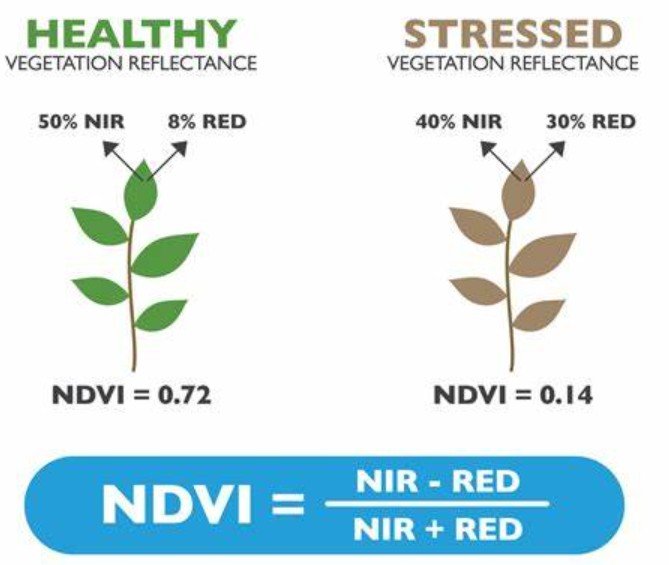
Leaves: A chemical compound in leaves called chlorophyll strongly absorbs radiation in the red and blue wavelengths but reflects green wavelengths. Leaves appear “greenest“ to us in the summer, when chlorophyll content is at its maximum. In autumn, there is less chlorophyll in the leaves, so there is less absorption and proportionately more reflection of the red wavelengths, making the leaves appear red or yellow (yellow is a combination of red and green wavelengths). The internal structure of healthy leaves act as excellent diffuse reflectors of near-infrared wavelengths. If our eyes were sensitive to near-infrared, trees would appear extremely bright to us at these wavelengths. In fact, measuring and monitoring the near-IR reflectance is one way that scientists can determine how healthy (or unhealthy) vegetation may be.
Water: Longer wavelength visible and near infrared radiation is absorbed more by water than shorter visible wavelengths. Thus, water typically looks blue or blue-green due to stronger reflectance at these shorter wavelengths, and darker if viewed at red or near infrared wavelengths. If there is suspended sediment present in the upper layers of the water body, then this will allow better reflectivity and a brighter appearance of the water. The apparent colour of the water will show a slight shift to longer wavelengths. Suspended sediment (S) can be easily confused with shallow (but clear) water, since these two phenomena appear very similar. Chlorophyll in algae absorbs more of the blue wavelengths and reflects the green, making the water appear greener in colour when algae is present. The topography of the water surface (rough, smooth, floating materials, etc.) can also lead to complications for water-related interpretation due to potential problems of specular reflection and other influences on colour and brightness.
We can see from these examples that, depending on the complex make-up of the target that is being looked at, and the wavelengths of radiation involved, we can observe very different responses to the mechanisms of absorption, transmission, and reflection. By measuring the energy that is reflected (or emitted) by targets on the Earth’s surface over a variety of different wavelengths, we can build up a spectral response for that object. By comparing the response patterns of different features we may be able to distinguish between them, where we might not be able to, if we only compared them at one wavelength. For example, water and vegetation may reflect somewhat similarly in the visible wavelengths but are almost always separable in the infrared. Spectral response can be quite variable, even for the same target type, and can also vary with time (e.g. “green-ness” of leaves) and location. Knowing where to “look” spectrally and understanding the factors that influence the spectral response of the features of interest are critical to correctly interpreting the interaction of electromagnetic radiation with the surface.
2.4 Satellite images characteristics
Sensor
A sensor is a device that measures and records electromagnetic energy.
Sensors can be divided into two groups.
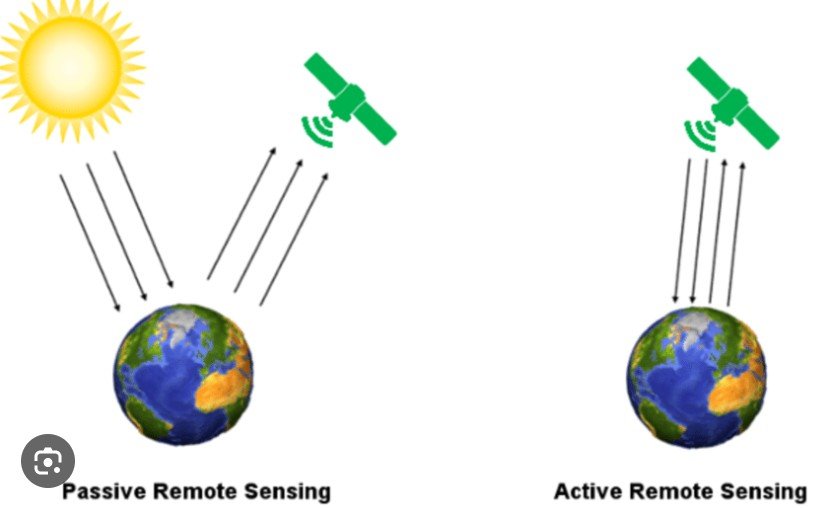
- Passive sensors depend on an external source of energy, usually the sun. Most of the satellite sensors are passive.
- Active sensors have their own source of energy, an example would be a radar gun. These sensors send out a signal and measure the amount reflected back. Active sensors are more controlled because they do not depend upon varying illumination conditions
Satellite Characteristics: Orbits and Swaths
Satellites have several unique characteristics which make them particularly useful for remote sensing of the Earth’s surface. The path followed by a satellite is referred to as its orbit. Satellite orbits are matched to the capability and objective of the sensor(s) they carry. Orbit selection can vary in terms of altitude (their height above the Earth’s surface) and their orientation and rotation relative to the Earth.
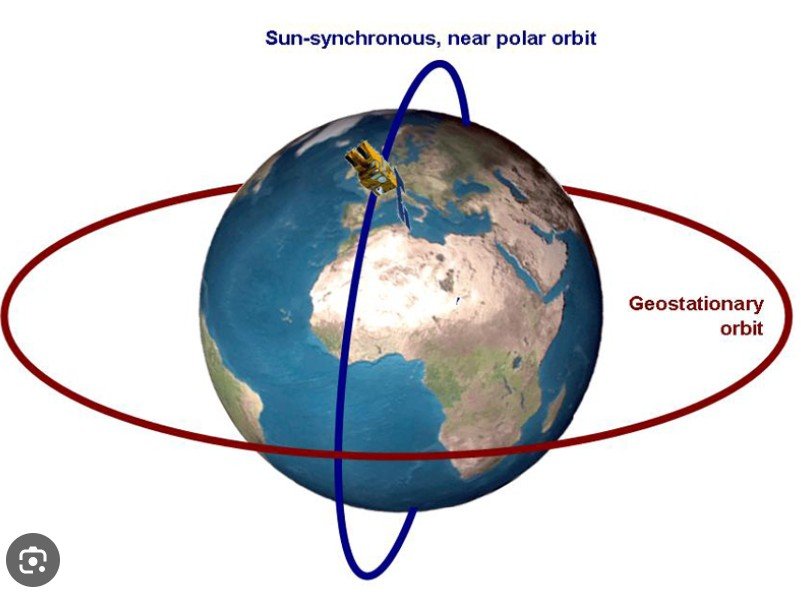
Geostationary Satellite
Satellites at very high altitudes, which view the same portion of the Earth’s surface at all times have geostationary orbits. These geostationary satellites revolve at speeds which match the rotation of the Earth so they seem stationary, relative to the Earth’s surface. This allows the satellites to observe and collect information continuously over specific areas. Weather and communications satellites commonly have these types of orbits. Due to their high altitude, some geostationary weather satellites can monitor weather and cloud patterns covering an entire hemisphere of the Earth.
Sun-synchronous Satellite
Many remote sensing platforms are designed to follow an orbit (basically north-south) which, in conjunction with the Earth’s rotation (west-east), allows them to cover most of the Earth’s surface over a certain period of time. These are nearpolar orbits, so named for the inclination of the orbit relative to a line running between the North and South poles. These satellite orbits are known as sun-synchronous.
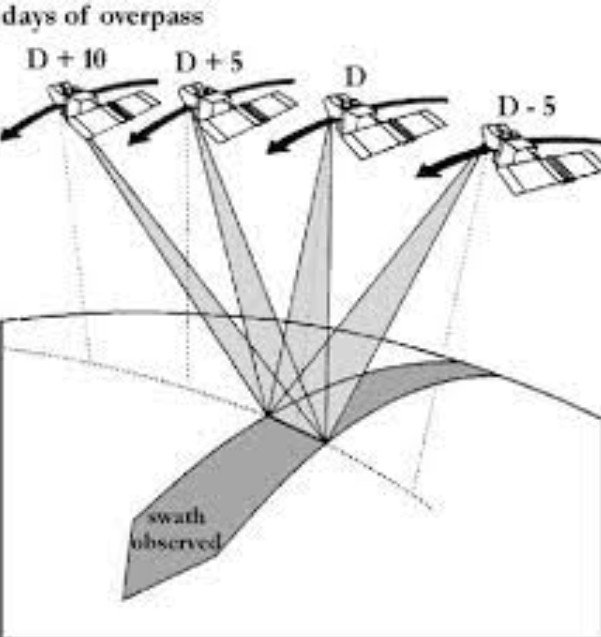
Swath
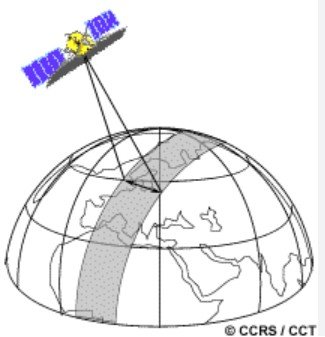
As a satellite revolves around the Earth, the sensor “sees” a certain portion of the Earth’s surface. The area imaged on the surface, is referred to as the swath.
Imaging swaths for space borne sensors generally vary between tens and hundreds of kilometers wide. As the satellite orbits the Earth from pole to pole, its east-west position wouldn’t change if the Earth didn’t rotate.
However, as seen from the Earth, it seems that the satellite is shifting westward because the Earth is rotating (from west to east) beneath it. This apparent movement allows the satellite swath to cover a new area with each consecutive pass. The satellite’s orbit and the rotation of the Earth work together to allow complete coverage of the Earth’s surface, after it has completed one complete cycle of orbits.
Satellite data characteristics
Remote sensing data characteristics play a crucial role in determining the quality and applicability of the acquired information. These characteristics encompass image resolution, spectral bands, spatial resolution, and temporal resolution. Here’s an overview of each:
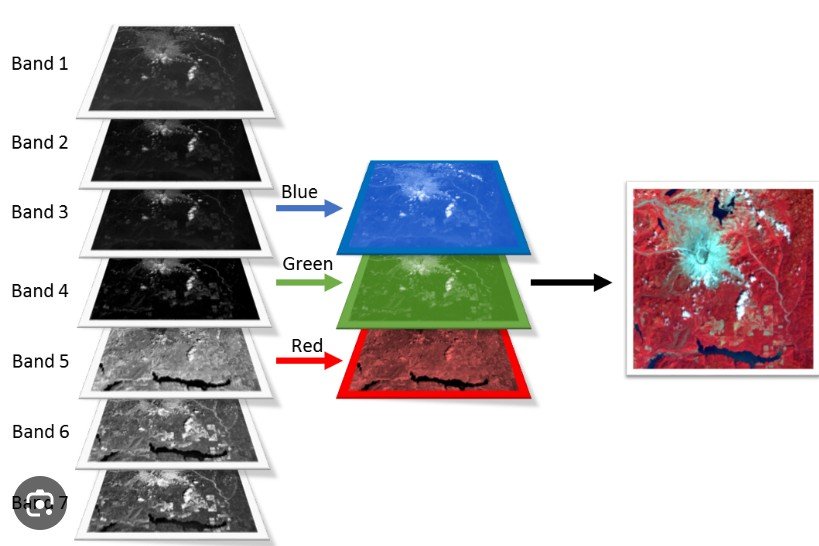
1. Spectral Bands
- Remote sensing sensors are equipped with multiple spectral bands, each sensitive to specific ranges of electromagnetic radiation (wavelengths).
- Different materials and features on the Earth’s surface have unique spectral signatures, allowing their identification and differentiation.
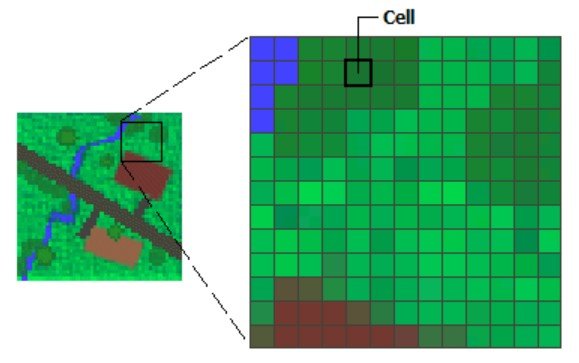
2. Spatial Resolution
- Spatial resolution refers to the level of detail in terms of the size of individual pixels in an image.
- High spatial resolution images have smaller pixels, capturing finer details, but covering a smaller area.
- Low spatial resolution images have larger pixels, offering a broader coverage but with less detail.
3. Temporal Resolution
- Temporal resolution indicates how frequently images are acquired over a specific area.
- Frequent revisits are critical for monitoring dynamic changes over time, such as urban growth, vegetation health, or natural disasters.
4. Radiometric Resolution
- Radiometric resolution refers to the ability of a sensor to distinguish between different levels of brightness (radiometric values) in an image.
3.1 Land use/land cover
Land use and land cover (LULC) refer to the physical and functional characteristics of the Earth’s surface, including the ways in which humans utilize and manage land resources. Land use describes how land is utilized for specific human activities, such as residential, commercial, agricultural, industrial, or recreational purposes. Land cover, on the other hand, focuses on the types of natural and artificial features present on the Earth’s surface, such as forests, water bodies, urban areas, croplands, and barren land.
Classes of Land Use/Land Cover
LULC is often categorized into various classes to represent different features and activities. These classes provide a standardized way to classify and analyze the Earth’s surface. The specific classes can vary depending on the classification system used and the objectives of the analysis.
Sentinel satellites, operated by the European Space Agency (ESA), provide data that can be used for land use and land cover classification. The Sentinel-2 satellites, in particular, are known for their high-resolution multispectral imagery, which is valuable for monitoring changes in land use and land cover over time. The data from Sentinel-2 satellites can be used to classify various land use and land cover classes.
Here are some common land use and land cover classes that can be identified and classified using Sentinel satellite data:
- Urban Areas: This class includes cities, towns, and other developed areas characterized by a high density of buildings, roads, and infrastructure.
- Agricultural Land: This class encompasses areas used for farming, including croplands, orchards, vineyards, and other cultivated areas.
- Forest and Woodland: This class includes areas covered by forests and wooded landscapes, which can be further categorized based on tree type and density.
- Grassland and Pasture: These areas are characterized by the presence of grasses and are often used for grazing livestock.
- Water Bodies: This class includes rivers, lakes, reservoirs, and other bodies of water.
- Wetlands: Wetlands consist of areas with a high-water table or areas that are periodically flooded, such as swamps, marshes, and bogs.
- Bare Soil and Desert: These areas have minimal vegetation cover and are often characterized by exposed soil, sand, or rock.
- Snow and Ice: This class includes regions covered by snow and ice, typically found in polar regions and at high elevations.
- Built-up Areas: This subclass of the urban class focuses specifically on areas with dense human-made structures.
- Crops and Plantations: This subclass of agricultural land focuses on specific types of crops, such as large plantations of a single crop.
- Shrubland: These areas are characterized by low, woody vegetation, often found in semi-arid regions.
- Bodies of Water (Inland): This subclass of water bodies focuses specifically on inland water features, such as lakes and reservoirs.
- Bodies of Water (Coastal): This subclass of water bodies focuses on coastal areas, including shorelines and estuaries.
- Glaciers: This subclass of snow and ice class specifically refers to large masses of ice formed from the accumulation and compaction of snow.
Conservation policies related to land use and land cover
Conservation policies related to land use and land cover are designed to manage and protect natural resources, biodiversity, and ecosystems while accommodating human activities and development. These policies often aim to balance economic growth with environmental sustainability. Here are some common types of conservation policies in the context of land use and land cover:
- Zoning and Land Use Planning: Governments establish zoning regulations and land use plans to guide development in different areas. This helps separate incompatible land uses and designate areas for conservation, residential, commercial, industrial, and recreational purposes.
- Protected Areas and Reserves: Designating and managing protected areas, such as national parks, wildlife reserves, and marine protected areas, helps conserve ecosystems and species. These areas often have restrictions on certain activities to prevent habitat destruction and overexploitation.
- Habitat Restoration: Policies that support habitat restoration involve identifying degraded ecosystems and implementing strategies to restore their natural functions and biodiversity. This can include reforestation, wetland restoration, and invasive species removal.
- Land Conservation Easements: These are legal agreements between landowners and conservation organizations or governments. Landowners agree to limit certain types of development or land use on their property to protect its natural features and ecological value.
- Smart Growth and Compact Development: These policies encourage efficient land use by promoting denser, more walkable communities that reduce urban sprawl. By concentrating development in existing urban areas, open spaces and natural habitats can be preserved.
- Agricultural Conservation Programs: These programs offer incentives to farmers to adopt sustainable agricultural practices that protect soil health, water quality, and biodiversity. Examples include crop rotation, reduced pesticide use, and riparian buffer zones.
- Forest Management and Timber Harvesting Regulations: Forest management policies aim to balance timber harvesting with forest conservation. Regulations can include sustainable harvesting quotas, protection of old-growth forests, and reforestation requirements.
- Wetland and Riparian Area Protection: Policies aimed at safeguarding wetlands and riparian areas help maintain water quality, prevent erosion, and support diverse ecosystems. Regulations may limit development near these sensitive areas.
- Urban Green Spaces and Parks: Creating and maintaining urban green spaces, such as parks and community gardens, enhances the quality of life for residents and provides habitat for local flora and fauna.
- Land Use Impact Assessments: Before major development projects are approved, environmental impact assessments (EIAs) are conducted to evaluate potential effects on land use, ecosystems, and biodiversity. This helps decision-makers understand and mitigate negative impacts.
- Climate Change Adaptation: Policies that address climate change often intersect with land use and cover conservation. Strategies might include protecting natural carbon sinks like forests, preserving wetlands to buffer against sea-level rise, and promoting resilient land-use patterns.
It’s important to note that the effectiveness of these policies can vary depending on factors such as local context, enforcement, community engagement, and changes in economic and social conditions. Conservation policies related to land use and land cover are crucial for maintaining ecological balance and ensuring a sustainable future for both humans and the natural world.
Use of Google Earth Engine (GEE) for Land use and land classes Data Analysis
In Google Earth Engine (GEE), you have access to a wide range of data sources that can be used for land use and land cover (LULC) analysis. These data sources include satellite imagery, remote sensing datasets, and various derived products. Here are some commonly used data sources and their characteristics in GEE for land use and land cover analysis:
- Landsat Images:
- Landsat 5, 7, and 8 satellite imagery is available in GEE.
- Spatial Resolution: 30 meters (Landsat 5, 7), 15 meters (Landsat 8 panchromatic), 30 meters (Landsat 8 multispectral).
- Temporal Resolution: Landsat satellites revisit approximately every 16 days.
- Sentinel-2 Images:
- Sentinel-2A and 2B satellite imagery is available.
- Spatial Resolution: 10 meters, 20 meters, and 60 meters.
- Temporal Resolution: Sentinel-2A and 2B combined provide a 5-day revisit interval.
- MODIS Images:
- Moderate Resolution Imaging Spectroradiometer (MODIS) data is available for various products like land surface temperature, vegetation indices, and land cover dynamics.
- Spatial Resolution: Varies from 250 meters to 1 kilometer.
- Temporal Resolution: Daily revisits.
- NLCD (National Land Cover Database):
- NLCD data for the United States provides detailed land cover and land use information.
- Spatial Resolution: 30 meters.
- Temporal Resolution: Available for different years.
- Hansen Global Forest Change Dataset:
- Provides data on global forest cover and change over time.
- Spatial Resolution: 30 meters.
- Temporal Resolution: Available for different years.
- Global Urban Footprint:
- Provides information about urban extent and land cover.
- Spatial Resolution: 12 meters.
- Temporal Resolution: Varies by dataset.
- Global Cropland Data:
- Datasets like Global Agriculture Monitoring (GLAM) provide cropland extent and crop type information.
- Spatial Resolution: Varies by dataset.
- Temporal Resolution: Varies by dataset.
- Land Cover Classification Products:
- Pre-classified land cover datasets like Copernicus Global Land Cover can be used for analysis.
- Spatial Resolution: Varies by dataset.
- Temporal Resolution: Varies by dataset.
- Vegetation Indices:
- Derived from satellite imagery, various vegetation indices like NDVI, EVI, and SAVI are available for analysing vegetation health and cover.
Characteristics of these data sources include spatial and temporal resolutions, availability of historical data, spectral bands, and thematic accuracy. In GEE, you can use these data sources along with the platform’s analysis capabilities to perform land use and land cover classification, change detection, time-series analysis, and more. Keep in mind that the choice of data source depends on your specific analysis goals and the geographic area of interest.
Landuse & Landcover – 2017 – 2022
NDVI Time Series – Click at Nigeria Map
3.2 Climate
Climate refers to the long-term patterns of temperature, humidity, wind, precipitation, and other atmospheric conditions in a specific region over extended periods, typically spanning decades to centuries. It encompasses the interactions between various components of the Earth’s atmosphere, oceans, land surfaces, and ice.
In the context of Policy and Strategic Studies, climate holds significant importance due to its far-reaching impacts on various aspects of human society, the environment, and economies.
Climate variables of Policy and Strategic Studies
“Climate variables” in the context of Policy and Strategic Studies generally refer to the key factors and metrics related to climate change that inform policy decisions and strategic planning. These variables help policymakers and strategists understand the current and projected impacts of climate change, as well as the effectiveness of various mitigation and adaptation strategies. Here are some important climate variables relevant to Policy and Strategic Studies:
- Temperature: Monitoring changes in global and regional temperatures is crucial for understanding the extent of climate change. Rising temperatures can have various impacts on ecosystems, agriculture, water resources, and human health.
- Precipitation Patterns: Changes in precipitation patterns, including shifts in rainfall intensity and distribution, affect water availability, agriculture, and the frequency of extreme weather events like floods and droughts.
- Sea Level Rise: Sea level rise is a critical variable, especially for coastal regions. Rising sea levels can lead to saltwater intrusion, erosion, and increased vulnerability to storm surges.
- Extreme Weather Events: Tracking the frequency and intensity of extreme weather events such as hurricanes, heatwaves, and wildfires is crucial for understanding climate-related risks and planning disaster response strategies.
- Glacial Retreat and Ice Melt: Changes in glacial and polar ice contribute to sea level rise and can have global implications. Monitoring ice melt helps assess the rate of change in these regions.
- Ocean Acidification: Increasing carbon dioxide levels in the atmosphere also lead to higher CO2 levels in the oceans, causing ocean acidification. This can have significant impacts on marine ecosystems, including coral reefs and shellfish.
- Biodiversity Loss: Climate change affects ecosystems and biodiversity, leading to shifts in species distribution and potential extinctions. Monitoring biodiversity changes informs conservation efforts.
- Carbon Dioxide (CO2) Levels: Rising atmospheric CO2 levels are a primary driver of climate change. Monitoring CO2 concentrations helps assess the progress of emissions reduction efforts.
- Methane and Other Greenhouse Gases: Besides CO2, other greenhouse gases like methane (CH4) play a significant role in climate change. Monitoring these gases is important for comprehensive emissions management.
- Land Use Changes: Changes in land cover, such as deforestation and urbanization, contribute to climate change. Monitoring land use helps identify areas where policies can be implemented to mitigate impacts.
- Energy Consumption and Emissions: Tracking energy consumption and greenhouse gas emissions by sectors (such as transportation, industry, and agriculture) helps guide policies aimed at reducing emissions.
- Climate Models and Projections: Climate models use current data to project future climate scenarios. These models are crucial for assessing potential impacts and developing long-term policy strategies.
- Social and Economic Impacts: Understanding how climate change affects social systems, economies, and vulnerable populations informs policies focused on adaptation and resilience.
- International Agreements and Commitments: Monitoring the progress of international agreements (e.g., Paris Agreement) and commitments made by countries to reduce emissions and address climate change is crucial for global coordination.
These climate variables are essential for policymakers and strategists to develop effective policies and strategies to address climate change’s challenges and opportunities. They provide the basis for informed decision-making and for prioritizing actions to mitigate and adapt to the impacts of a changing climate.
Climate- perspective of Policy and Strategic Studies
From the perspective of Policy and Strategic Studies, climate research plays a critical role in shaping effective policies, strategies, and decision-making processes to address the challenges posed by climate change. Here’s how climate research is important within the context of Policy and Strategic Studies:
- Informed Policy Formulation: Climate research provides policymakers with the necessary data, information, and insights to formulate evidence-based policies that address climate-related issues. It helps policymakers understand the scientific basis of climate change, its impacts on various sectors, and the potential consequences of different policy options.
- Risk Assessment and Management: Climate research allows for the assessment and management of climate-related risks. Policymakers can identify vulnerable areas, populations, and critical infrastructure that may be affected by extreme weather events, sea-level rise, or other climate-related hazards. Strategic plans can be developed to mitigate and adapt to these risks.
- Long-Term Planning and Foresight: Policy and Strategic Studies emphasize long-term thinking and foresight. Climate research contributes to understanding how climate change will evolve over time, enabling policymakers to anticipate future challenges and develop strategies that ensure resilience and sustainability.
- International Diplomacy and Agreements: Climate change is a global issue that requires international cooperation. Policy and Strategic Studies researchers analyze the geopolitical implications of climate change, negotiate international climate agreements, and assess the impacts of climate policies on diplomatic relations.
- Resource Allocation and Budgeting: Climate research informs resource allocation decisions. Policymakers can allocate funding to sectors that are most vulnerable to climate change or invest in projects that promote sustainable practices and technologies.
- Public Perception and Engagement: Understanding public perceptions and attitudes toward climate change is crucial for effective policy implementation. Climate research helps policymakers design communication strategies that raise awareness, build public support, and encourage behavioural changes.
- Legal and Regulatory Frameworks: Climate research contributes to the development of legal and regulatory frameworks that govern environmental protection, emissions reduction, and sustainable development. It helps policymakers draft legislation that aligns with international climate commitments and national priorities.
- Technology and Innovation Policies: Climate research identifies innovative technologies and practices that can contribute to emissions reduction and adaptation. Policymakers can design policies that incentivize the adoption of clean energy technologies, sustainable transportation, and eco-friendly practices.
- Economic Implications: Climate research assesses the economic costs and benefits of climate-related policies. Policymakers can make informed decisions about investing in green industries, transitioning to a low-carbon economy, and creating jobs in sustainable sectors.
- Conflict Prevention and Security: Climate change can exacerbate resource scarcity, displacement, and social tensions, leading to potential conflicts. Policy and Strategic Studies researchers analyze the security implications of climate change and develop strategies to prevent and address climate-induced conflicts.
In essence, climate research within the framework of Policy and Strategic Studies enables policymakers to take a holistic and proactive approach to addressing the challenges of climate change. It empowers them to design comprehensive strategies, allocate resources effectively, engage stakeholders, and make informed decisions that contribute to a sustainable and resilient future.
Use of Google Earth Engine (GEE) for Climate Data Analysis
Google Earth Engine (GEE) is a powerful platform that allows users to access and analyze a wide range of geospatial data, including climate-related variables. GEE provides a vast collection of datasets that can be used to study various climate parameters and trends. Here are some examples of climate variables that you can access and analyze using Google Earth Engine:
- Temperature Data:
- Land Surface Temperature (LST): This data provides information about the temperature of the Earth’s surface.
- Sea Surface Temperature (SST): SST data is crucial for understanding oceanic climate patterns.
- Precipitation Data:
- Precipitation: Various datasets offer information on precipitation patterns, which are vital for studying water availability and climate-related risks.
- Evapotranspiration:
- Evapotranspiration (ET): ET data helps assess the amount of water vapor returned to the atmosphere through evaporation and plant transpiration.
- Climate Reanalysis Data:
- Climate reanalysis datasets provide a comprehensive view of past climate conditions, including variables like temperature, precipitation, wind patterns, and more.
- Wind Speed and Direction:
- Wind vectors: These datasets provide information about wind speed and direction, important for understanding atmospheric circulation patterns.
- Humidity:
- Relative Humidity: Humidity data helps in assessing moisture content in the atmosphere.
- Solar Radiation:
- Incoming Solar Radiation: This data is crucial for understanding energy balance and climate patterns.
- Sea Level Anomalies:
- Sea level anomaly datasets help track variations in sea level, providing insights into oceanic and climate dynamics.
- Drought Indices:
- Drought indices like the Standardized Precipitation Index (SPI) and Palmer Drought Severity Index (PDSI) can help monitor drought conditions.
- Fire and Burn Area Data:
- Data on fire occurrences and burn areas can be used to study the impact of climate on wildfire patterns.
These are just a few examples of the climate-related variables you can access and analyze using Google Earth Engine. The platform offers a wide range of datasets from various sources, including satellite observations and climate models. You can use the GEE Code Editor to write scripts and perform analyses on these variables, enabling you to study climate trends, assess impacts, and make informed decisions related to climate change and environmental management.
In Google Earth Engine (GEE), you can access a variety of climate-related data sources that provide information on temperature, precipitation, and other climate variables. These datasets are valuable for analysing climate patterns, trends, and impacts. Here are some climate data sources available in GEE along with their characteristics:
- Climate Hazards Group InfraRed Precipitation with Station data (CHIRPS):
- Characteristics: High-resolution precipitation data based on satellite observations and ground station data.
- Temporal Resolution: Daily.
- Spatial Resolution: Approximately 5 km.
- Tropical Rainfall Measuring Mission (TRMM):
- Characteristics: Precipitation data from TRMM satellite observations.
- Temporal Resolution: Various time intervals (e.g., 3-hourly, monthly).
- Spatial Resolution: Varies based on product.
- Climate Prediction Center (CPC) Unified Precipitation:
- Characteristics: Global precipitation data provided by the CPC.
- Temporal Resolution: Daily.
- Spatial Resolution: Approximately 0.25 degrees.
- Climate Prediction Center (CPC) Temperature:
- Characteristics: Global temperature data provided by the CPC.
- Temporal Resolution: Daily.
- Spatial Resolution: Approximately 0.5 degrees.
- MODIS Land Surface Temperature (LST):
- Characteristics: Land surface temperature data derived from MODIS satellite observations.
- Temporal Resolution: Daily.
- Spatial Resolution: Varies (approximately 1 km).
- Global Precipitation Climatology Centre (GPCC) Full Data Reanalysis Version 7:
- Characteristics: Gridded global precipitation data from rain gauges and other sources.
- Temporal Resolution: Monthly.
- Spatial Resolution: 0.5 degrees.
- Climate Research Unit (CRU) TS4.04:
- Characteristics: Global climate dataset with temperature and precipitation variables.
- Temporal Resolution: Monthly.
- Spatial Resolution: 0.5 degrees.
- ERA5 Climate Data Assimilation System:
- Characteristics: Reanalysis dataset from the European Centre for Medium-Range Weather Forecasts (ECMWF).
- Temporal Resolution: Hourly, daily, monthly.
- Spatial Resolution: Various resolutions (e.g., 0.25 degrees).
- Daymet: Daily Surface Weather Data on a 1-km Grid for North America:
- Characteristics: High-resolution daily weather data for North America.
- Temporal Resolution: Daily.
- Spatial Resolution: Approximately 1 km.
These datasets provide valuable information for analyzing climate patterns, trends, and variability. When using these data sources in GEE, consider the specific climate variable you’re interested in, the geographic area of interest, and the desired temporal and spatial resolutions. GEE’s processing capabilities allow you to perform various analyses, visualize trends, and gain insights into climate-related patterns and impacts.
Sum of Pentad Precipitation – 1980-2022 – Click at Nigeria Map
Mean Monthly Temperature – 2015 – 2022 – Click at Nigeria Map
4.1 Human Population and Settlements
Definitions
Human Population refers to the total number of people living in a specific geographic area, such as a city, country, or the entire world. It is a fundamental demographic variable that represents the size of a community or society. Human population is influenced by birth rates, death rates, immigration, and emigration, and it plays a significant role in shaping various social, economic, and environmental dynamics.
Settlements refer to places where people live, work, and carry out various activities. Settlements range from small rural villages to large cities. They include residential areas, commercial districts, industrial zones, and infrastructure such as roads, schools, and hospitals.
Significance in Policy Making and Strategic Studies:
- Urban Planning and Infrastructure Development:
- Human population and settlement data are crucial for urban planning and designing infrastructure projects. Policies need to consider the needs of growing populations in terms of housing, transportation, water supply, waste management, and other essential services.
- Resource Allocation and Service Delivery:
- Policies are developed based on the distribution of human populations. Population data helps allocate resources efficiently and ensure that public services such as healthcare, education, and sanitation are provided to all citizens.
- Economic Development:
- The size and distribution of the human population influence economic policies. Policies aimed at creating jobs, promoting industries, and attracting investments are often tailored to the demographics of specific areas.
- Social Welfare and Equity:
- Understanding population distribution helps identify areas with higher vulnerability or underserved populations. Policies can be designed to address social inequalities and ensure equitable access to opportunities and services.
- Environmental Sustainability:
- Human settlements impact the environment through land use, resource consumption, waste generation, and pollution. Policies that promote sustainable development and manage urban expansion can mitigate environmental degradation.
- Disaster Preparedness and Response:
- Population distribution is a critical factor in disaster risk assessment. Policies address the resilience of settlements against natural disasters and facilitate evacuation and relief efforts.
- Migration and Urbanization:
- Policies related to migration, rural-urban migration, and urbanization are influenced by population trends. Effective policies manage the challenges of rapid urbanization and provide support to migrants.
- Land Use and Land Cover Planning:
- Settlement patterns influence land use and land cover changes. Policies regulate land use to balance urban development with conservation and agricultural needs.
- Healthcare and Education Planning:
- Healthcare and education policies are designed based on the number of people in different age groups. Population data helps plan for facilities and resources needed to provide quality services.
- Census and Demographic Studies:
- Governments use population and settlement data for conducting censuses and demographic studies. These studies inform policies related to family planning, aging populations, and workforce trends.
In policy making and strategic studies, human population and settlements data provide essential insights for informed decision-making across diverse sectors. Understanding the dynamics of human settlement patterns helps governments and organizations develop strategies that cater to the needs of their citizens, promote sustainable development, and enhance overall quality of life.
Use of Google Earth Engine (GEE) for human population and settlements analysis.
Google Earth Engine (GEE) offers various data sources and tools to analyse human population and settlements. Google Building Footprints is vector dataset of building footprints extracted using AI from high-resolution satellite imagery. It’s a good source for estimating population based on building area and the number of people living there. Here are some other raster data sources and characteristics related to human population and settlements in GEE:
- Gridded Population of the World (GPW):
- Characteristics: High-resolution global population data, available in different versions (e.g., GPWv4, GPWv4.11).
- Spatial Resolution: Varies (e.g., 30 arc-seconds, 2.5 arc-minutes).
- Temporal Resolution: Usually available for multiple years.
- Image ID Example: ‘JRC/GHSL/P2016/POP_GPW_GLOBE_V1/2015’.
- Global Human Settlement Layer (GHSL):
- Characteristics: Provides information on built-up areas and population distribution.
- Spatial Resolution: 38 meters.
- Temporal Resolution: Available for different years.
- Image ID Example: ‘JRC/GHSL/P2016/BUILT_LDSMT_GLOBE_V1’.
- World Settlement Footprint (WSF):
- Characteristics: Global dataset depicting built-up areas and settlement extents.
- Spatial Resolution: 10 meters.
- Temporal Resolution: Usually available for multiple years.
- Image ID Example: ‘ESA/GLOBCOVER_L4_200901_200912_V2_3’.
- LandScan Global Population Database:
- Characteristics: Provides gridded population estimates at a high spatial resolution.
- Spatial Resolution: Approximately 1 km.
- Temporal Resolution: Available for different years.
- Image ID Example: ‘NASA/SEDAC/LANDSCAN/2018’.
- High Resolution Settlement Layer (HRSL):
- Characteristics: Offers high-resolution data on human settlements.
- Spatial Resolution: 30 meters.
- Temporal Resolution: Usually available for multiple years.
- Image ID Example: ‘WRI/GHS/HRS_POP_GPW_GLOBE_V1’.
- Urban Atlas Data:
- Characteristics: Provides detailed information on urban areas across Europe.
- Spatial Resolution: Varies (e.g., 2.5 meters, 25 meters).
- Temporal Resolution: Available for different years.
- Image ID Example: ‘COPERNICUS/Land_Use/Urban_Atlas/2012’.
These datasets offer insights into human population distribution, urbanization, and settlement patterns. They are valuable for understanding demographic trends, planning infrastructure, and assessing the impact of urban growth on the environment. When using these datasets in GEE, you can analyze and visualize changes in population density, urban expansion, and settlement dynamics over time
Estimated Residential Population per 100x100m Grid Square
4.2 Human Development
Human Development refers to the process of improving the well-being, capabilities, and quality of life of individuals and communities. It encompasses factors beyond economic growth and income, taking into account aspects such as education, healthcare, access to basic services, social inclusion, and individual empowerment. The concept of human development emphasizes that development should be centered on people and their capabilities, rather than solely focusing on economic indicators.
Significance in Policy Making and Strategic Studies:
- Holistic Well-being:
- Human development policies recognize that well-being extends beyond economic measures. They focus on improving access to education, healthcare, clean water, sanitation, and other essential services that directly impact people’s lives.
- Social Inclusion and Equity:
- Policies targeting human development aim to reduce inequalities in society. They ensure that marginalized and vulnerable populations have equal access to opportunities and services, promoting social cohesion and harmony.
- Healthcare and Education:
- Human development policies prioritize investments in healthcare and education. Policies focus on improving maternal and child health, reducing disease burden, and enhancing the quality of education to empower individuals.
- Human Capital Development:
- Human development recognizes people as valuable assets. Policies emphasize skill development, training, and education to enhance human capital, which contributes to long-term economic growth and sustainability.
- Poverty Reduction:
- While economic growth can contribute to poverty reduction, human development policies directly target poverty alleviation through access to education, healthcare, and income-generating opportunities.
- Empowerment and Participation:
- Human development encourages active participation of individuals and communities in decision-making processes. Policies empower citizens to voice their needs, contributing to more responsive and inclusive governance.
- Sustainable Development:
- Human development is closely linked to environmental sustainability. Policies ensure that development is achieved without depleting natural resources and damaging ecosystems, promoting a balance between human well-being and the environment.
- Quality of Life Improvement:
- Policies centered on human development aim to enhance people’s quality of life by addressing their diverse needs, aspirations, and concerns. This leads to happier, healthier, and more fulfilled lives.
- Long-Term Prosperity:
- Investing in human development contributes to the long-term prosperity of a nation. A skilled and healthy workforce is more productive and innovative, driving economic growth and competitiveness.
- Global Cooperation and Development Goals:
- Human development aligns with global development goals, including the United Nations Sustainable Development Goals (SDGs). It provides a framework for countries to work together towards common objectives.
- Conflict Prevention and Social Stability:
- Human development policies can contribute to reducing social disparities, fostering inclusivity, and preventing conflicts arising from inequalities and grievances.
- Measurement of Progress:
- Human development indices, such as the Human Development Index (HDI), provide a comprehensive measure of a country’s progress beyond economic metrics. These indices help policymakers assess the impact of their policies.
In policy making and strategic studies, human development provides a comprehensive framework for assessing and promoting the well-being of individuals and societies. Policies that prioritize human development contribute to sustainable, inclusive, and equitable development that improves the lives of people and enhances the overall prosperity of nations.
Use of Google Earth Engine (GEE) for human development analysis
Studying human development using nighttime light data in Google Earth Engine (GEE) can provide valuable insights into urbanization, economic activity, and population dynamics. Nighttime light data, such as those from the Visible Infrared Imaging Radiometer Suite (VIIRS) or Defense Meteorological Satellite Program (DMSP) sensors, can be used to analyze urban growth and changes over time. Here’s how you can study human development focusing on nighttime light data in GEE:
- Data Preparation:
- Identify the nighttime light dataset you want to use (e.g., VIIRS or DMSP).
- Load the dataset in GEE using the appropriate image collection (e.g., ‘NOAA/VIIRS/DNB/MONTHLY_V1’ for VIIRS).
- Define the region of interest (ROI) you want to analyse.
- Temporal Analysis:
- Filter the image collection based on the time period you are interested in.
- Create a time series animation to visualize changes in nighttime lights over time.
- Urban Growth Analysis:
- Use image differencing techniques to analyze changes in nighttime lights between different time periods. This can help identify areas of urban growth and expansion.
- Cluster Analysis:
- Apply clustering algorithms (e.g., k-means) to group pixels with similar nighttime light patterns. This can help identify urban centers and other urbanized regions.
- Statistical Analysis:
- Calculate statistical metrics such as mean, median, or standard deviation of nighttime lights to assess the intensity of urbanization in different areas.
- Correlation with Human Development Indicators:
- Overlay nighttime light data with other human development indicators like population density, GDP, or education data. Analyze the correlation between nighttime lights and these indicators.
- Change Detection:
- Use change detection techniques to identify abrupt changes in nighttime light patterns, which could indicate significant urban development or changes in economic activity.
- Hotspot Analysis:
- Identify hotspots and coldspots of nighttime light intensity to pinpoint areas with higher or lower levels of urbanization or economic activity.
- Visualization and Mapping:
- Create maps and visualizations to display nighttime light intensity, changes, and correlations with other data layers.
- Validation and Interpretation:
- Validate your findings by comparing them with ground-truth data or existing studies on urbanization and human development in the region.
Remember that nighttime light data have limitations, including potential inaccuracies due to clouds, atmospheric conditions, and sensor saturation. Additionally, changes in nighttime lights might not always directly correlate with human development; other factors like industrial activities and energy use can also influence light patterns. Therefore, it’s important to interpret your findings in the broader context of social, economic, and environmental factors.
To execute these analyses, you’ll need to use GEE’s JavaScript or Python API and have some familiarity with coding and remote sensing techniques. The GEE documentation provides sample code and tutorials to help you get started.
Night Light Data – Click at Nigeria Map
5.1 Role of remote sensing in evidence-based decision making.
Remote sensing plays a crucial role in evidence-based decision making across various sectors and disciplines. It provides valuable information about the Earth’s surface and atmosphere, enabling policymakers, researchers, and stakeholders to make informed choices and develop effective strategies. Here’s how remote sensing contributes to evidence-based decision making:
- Spatial and Temporal Information: Remote sensing captures spatial information from a bird’s-eye view, providing a comprehensive view of large areas. It also offers temporal data by tracking changes over time. This information helps decision makers understand trends, patterns, and dynamics.
- Data Accessibility and Availability: Remote sensing data is widely available from satellites, aircraft, and other sources. It covers a wide range of parameters such as land cover, vegetation health, temperature, and more. This accessibility ensures that decision makers have access to relevant data for their analyses.
- Objective and Consistent Data Collection: Remote sensing data collection is standardized and consistent, reducing subjectivity and bias. This objective information is crucial for accurate and unbiased decision making.
- Monitoring and Assessment: Remote sensing enables the continuous monitoring of environmental changes, infrastructure development, and land use. Decision makers can assess the impacts of policies and interventions over time.
- Risk Assessment and Disaster Management: Remote sensing helps assess risks from natural disasters, such as hurricanes, wildfires, and floods. Decision makers can plan evacuation routes, allocate resources, and respond effectively to emergencies.
- Environmental Management: Remote sensing data informs decisions related to natural resource management, conservation, and pollution control. It aids in assessing deforestation, habitat loss, and environmental degradation.
- Infrastructure Planning and Development: Remote sensing data supports urban planning, transportation network design, and infrastructure development. Decision makers can identify suitable locations, assess terrain, and plan efficient routes.
- Agriculture and Food Security: Remote sensing provides insights into crop health, yield prediction, and land suitability. This data assists in making decisions about irrigation, crop rotation, and food distribution.
- Climate Change and Adaptation: Remote sensing data helps monitor climate change indicators such as temperature, sea level rise, and glacier melt. This information informs adaptation strategies and policies.
- Health and Disease Monitoring: Remote sensing assists in tracking disease vectors, mapping disease spread, and assessing health risks. Decision makers can plan interventions to control disease outbreaks.
- Land Use Planning: Remote sensing supports land use zoning, urban growth management, and protected area designation. Decision makers can balance development with environmental conservation.
- Data-Driven Policies: Remote sensing data provides objective evidence that informs the development of policies, regulations, and guidelines. Data-driven policies are more likely to be effective and efficient.
- Transparency and Accountability: Remote sensing data fosters transparency by providing a visual representation of changes on the ground. This helps decision makers communicate their rationale to stakeholders.
In essence, remote sensing contributes reliable, objective, and up-to-date information that enhances the quality of evidence-based decision making. It enables stakeholders to consider a broader range of factors, anticipate potential outcomes, and develop strategies that are grounded in data and analysis.
5.2 Data integration and fusion: combining remote sensing data with ground-based data.
Data integration and fusion involve combining information from different sources, such as remote sensing data collected from satellites or aircraft and ground-based data collected through sensors, measurements, or surveys. This process enhances the accuracy, completeness, and contextual understanding of the data, leading to more comprehensive analyses and better-informed decisions. Integrating remote sensing data with ground-based data offers several advantages:
Incorporating remote sensing insights into policy strategy design enhances the evidence base, allows for informed decision making, and ensures that policies are adaptive, efficient, and aligned with real-world conditions. It bridges the gap between data-driven analysis and actionable policy implementation.