Course Title: Advanced Remote Sensing in Military Studies
Dr. Zubairul Islam
Associate Professor
GIS & Remote Sensing
zubairul@gmail.com
Course Description
This advanced course is designed for senior professionals with no prior background in remote sensing who seek to leverage the power of remote sensing technologies in policy making. Remote sensing plays a pivotal role in shaping informed decisions across various sectors, from environmental conservation to socio-economic development. This course will provide participants with a comprehensive understanding of remote sensing principles, applications, and its integration into policy formulation and implementation. Through a combination of theoretical lessons, case studies, and hands-on exercises, participants will gain the knowledge and skills required to harness remote sensing data for effective policy-making.
Course Content
Chapter 1: Introduction to Remote Sensing and Military Studies
1.1 Fundamentals of Remote Sensing
1.2 Remote sensing and its role in Military Studies
VIDEO LECTURE
Chapter Two: Electromagnetic energy and Satellite images characteristics
2.1 Electromagnetic Radiation
2.2 The Electromagnetic Spectrum
2.3 Energy Interactions with the Earth’s surface
2.4 Satellite image characteristics
VIDEO LECTURE
Chapter 3: Applications of Remote Sensing in Terrain Analysis
3.1 Terrain Analysis
GEE APPLICATION – TERRAIN ANALYSIS
Chapter 4: Environmental Monitoring Using Remote Sensing Techniques
4.1 Land use/land cover
MAP APPLICATION – LAND USE & LAND COVER
GEE APPLICATION – VEGETATION CHANGE
4.2 Climate
GEE APPLICATION -RAINFALL
GEE APPLICATION -TEMPERATURE
Chapter 5: Applications of Remote Sensing in assessment of Socio-economic development
5.1 Human Population and Settlements
GEE APPLICATION -POPULATION CHANGE
5.2 Human Development
GEE APPLICATION -NIGHT LIGHT DATA
https://youtu.be/AmKVl7J0OiU
1.1 Fundamentals of Remote Sensing.
Definition of Remote Sensing
Remote sensing is the science and art of acquiring information about the Earth’s surface and atmosphere from a distance, typically using sensors on aircraft or satellites. It involves the measurement and interpretation of electromagnetic radiation reflected or emitted by objects and areas on the Earth’s surface. Remote sensing provides valuable data for a wide range of applications, including environmental monitoring, resource management, disaster assessment, and scientific research.
Elements of Remote Sensing
There are seven elements that comprise the remote sensing process from beginning to end (Figure 1).
- Energy Source or Illumination (A) – The first requirement for remote sensing is to have an energy source that illuminates or provides electromagnetic energy to the target of interest.
- Radiation and the Atmosphere (B) – As the energy travels from its source to the target, it will come in contact with and interact with the atmosphere it passes through.
- Interaction with the Target (C) – Once the energy makes its way to the target through the atmosphere, it interacts with the target depending on the properties of both the target and the radiation.
- Recording of Energy by the Sensor (D) – After the energy has been scattered by, or emitted from the target, we require a sensor (remote – not in contact with the target) to collect and record the electromagnetic radiation.
- Transmission, Reception, and Processing (E) – The energy recorded by the sensor has to be transmitted, often in electronic form, to a receiving and processing station where the data are processed into an image (hardcopy and/or digital).
- Interpretation and Analysis (F) – the processed image is interpreted, visually and/or digitally or electronically, to extract information about the target which was illuminated.
- Application (G) – The final element of the remote sensing process is achieved when we apply the information, we have been able to extract from the imagery about the target in order to better understand it, reveal some new information, or assist in solving a particular problem.
1.2 Remote sensing and its role in Military Studies.
Remote sensing plays a crucial role in military studies by providing valuable information and intelligence to enhance situational awareness, mission planning, and overall operational effectiveness. Remote sensing in a military context involves the collection and analysis of data from various sensors and platforms, such as satellites, drones (unmanned aerial vehicles or UAVs), and reconnaissance aircraft. Here are some key ways in which remote sensing is utilized in military studies:
- Surveillance and Reconnaissance: Remote sensing technologies are used for monitoring and surveying enemy activities, terrain, and infrastructure. Satellites and UAVs equipped with high-resolution cameras, synthetic aperture radar (SAR), and other sensors can provide real-time or near-real-time imagery and data over large areas, allowing military forces to gather critical information without risking personnel.
- Terrain Analysis: Remote sensing helps military planners assess the geography and topography of an area of interest. This information is essential for planning troop movements, identifying potential ambush sites, and determining the best routes for military operations. Terrain analysis can be aided by elevation data collected through technologies like LIDAR (Light Detection and Ranging).
- Target Identification and Tracking: Remote sensing assists in identifying and tracking potential threats, such as enemy vehicles, aircraft, or missile launch sites. Infrared and multispectral sensors can detect heat signatures and distinct characteristics, helping military forces identify targets even in adverse weather conditions or at night.
- Environmental Monitoring: Military operations often have environmental impacts. Remote sensing can help assess and mitigate these impacts by monitoring factors like deforestation, pollution, and changes in land use caused by military activities.
- Weather and Environmental Data: Accurate weather information is crucial for military planning and operations. Remote sensing satellites provide data on weather patterns, atmospheric conditions, and oceanic phenomena, enabling better decision-making for military operations.
- Intelligence Gathering: Remote sensing, when combined with other sources of intelligence, can provide a more comprehensive understanding of a region or potential adversary. This can include monitoring communication signals, electronic intelligence (ELINT), and signals intelligence (SIGINT) gathered through remote sensing technology.
- Disaster Response: Remote sensing capabilities can be repurposed for humanitarian missions and disaster response. Military assets equipped with remote sensing technology can provide critical information for search and rescue operations, damage assessment, and disaster management.
- Border Security: Remote sensing is also used for monitoring and securing national borders. It can help detect illegal crossings, track smuggling activities, and identify potential threats along the border.
- Navigation and Guidance: GPS (Global Positioning System) is a form of remote sensing technology that is essential for military navigation and guiding weapons systems accurately to their targets.
- Communication: Satellite-based communication systems are crucial for secure and reliable military communications, enabling commanders to stay in contact with troops and coordinate operations globally.
In summary, remote sensing plays a multifaceted role in military studies, providing essential data and intelligence for defense, reconnaissance, surveillance, and overall military effectiveness. Advances in remote sensing technology continue to enhance the capabilities of armed forces, enabling them to make informed decisions and operate more effectively in various environments and conditions.
https://youtu.be/kKhhFmLmsTs
2.1 Electromagnetic Radiation
The first requirement for remote sensing is to have an energy source to illuminate the target (unless the sensed energy is being emitted by the target). This energy is in the form of electromagnetic radiation.
Two characteristics of electromagnetic radiation are particularly important for understanding remote sensing. These are the wavelength and frequency.
The wavelength is the length of one wave cycle, which can be measured as the distance between successive wave crests. Wavelength is usually represented by the Greek letter lambda (λ). Wavelength is measured in metres (m) or some factor of metres such as nanometres (nm, 10-9 metres), micrometres (μm, 10-6 metres) (μm, 10-6 metres) or centimetres (cm, 10-2 metres). Frequency refers to the number of cycles of a wave passing a fixed point per unit of time.
wavelength and frequency are inversely related to each other. The shorter the wavelength, the higher the frequency.
2.2 – The Electromagnetic Spectrum
The electromagnetic (EM) spectrum is the continuous range of electromagnetic radiation, extending from gamma rays (highest frequency & shortest wavelength) to radio waves (lowest frequency & longest wavelength) and including visible light.
The EM spectrum can be divided into seven different regions —gamma rays, X-rays, ultraviolet, visible light, infrared, microwaves and radio waves.

Remote sensing involves the measurement of energy in many parts of the electromagnetic (EM) spectrum. The major regions of interest in satellite sensing are visible light, reflected and emitted infrared, and the microwave regions. The measurement of this radiation takes place in what are known as spectral bands. A spectral band is defined as a discrete interval of the EM spectrum. For example the wavelength range of 0.4μm to 0.5μm is one spectral band.
Satellite sensors have been designed to measure responses within particular spectral bands to enable the discrimination of the major Earth surface materials. Scientists will choose a particular spectral band for data collection depending on what they wish to examine.
The design of satellite sensors is based on the absorption characteristics of Earth surface materials across all the measurable parts in the EM spectrum.
Visible Spectrum
The light which our eyes – our “remote sensors” – can detect is part of the visible spectrum.
It is important to recognize how small the visible portion is relative to the rest of the spectrum.
There is a lot of radiation around us which is invisible to our eyes, but can be detected by other remote sensing instruments and used to our advantage.
It is important to note that this is the only portion of the EM spectrum we can associate with the concept of colors.
Blue, green, and red are the primary colors or wavelengths of the visible spectrum.
They are defined as such because no single primary color can be created from the other two, but all other colors can be formed by combining blue, green, and red in various proportions.
Although we see sunlight as a uniform or homogeneous color, it is actually composed of various wavelengths of radiation in primarily the ultraviolet, visible and infrared portions of the spectrum.
The visible portion of this radiation can be shown in its component colors when sunlight is passed through a prism.
Infrared (IR) Region
The IR Region covers the wavelength range from approximately 0.7 μm to 100 μm – more than 100 times as wide as the visible portion!
The IR region can be divided into two categories based on their radiation properties – the reflected IR, and the emitted or thermal IR.
Reflected and Thermal IR
Radiation in the reflected IR region is used for remote sensing purposes in ways very similar to radiation in the visible portion. The reflected IR covers wavelengths from approximately 0.7 μm to 3.0 μm.
The thermal IR region is quite different than the visible and reflected IR portions, as this energy is essentially the radiation that is emitted from the Earth’s surface in the form of heat. The thermal IR covers wavelengths from approximately 3.0 μm to 100 μm.
2.3 Energy Interactions with the Earth’s surface.
Radiation that is not absorbed or scattered in the atmosphere can reach and interact with the Earth’s surface. There are three (3) forms of interaction that can take place when energy strikes, or is incident (I) upon the surface.
These are: absorption (A); transmission (T); and reflection (R).
The total incident energy will interact with the surface in one or more of these three ways. The proportions of each will depend on the wavelength of the energy and the material and condition of the feature.
Absorption (A) occurs when radiation (energy) is absorbed into the target while transmission (T) occurs when radiation passes through a target. Reflection (R) occurs when radiation “bounces” off the target and is redirected. In remote sensing, we are most interested in
measuring the radiation reflected from targets. We refer to two types of reflection, which represent the two extreme ends of the way in which energy is reflected from a target: specular reflection and diffuse reflection.
Let’s take a look at a couple of examples of targets at the Earth’s surface and how energy at the visible and infrared wavelengths interacts with them.
Leaves: A chemical compound in leaves called chlorophyll strongly absorbs radiation in the red and blue wavelengths but reflects green wavelengths. Leaves appear “greenest“ to us in the summer, when chlorophyll content is at its maximum. In autumn, there is less chlorophyll in the leaves, so there is less absorption and proportionately more reflection of the red wavelengths, making the leaves appear red or yellow (yellow is a combination of red and green wavelengths). The internal structure of healthy leaves act as excellent diffuse reflectors of near-infrared wavelengths. If our eyes were sensitive to near-infrared, trees would appear extremely bright to us at these wavelengths. In fact, measuring and monitoring the near-IR reflectance is one way that scientists can determine how healthy (or unhealthy) vegetation may be.
Water: Longer wavelength visible and near-infrared radiation is absorbed more by water than shorter visible wavelengths. Thus, water typically looks blue or blue-green due to stronger reflectance at these shorter wavelengths, and darker if viewed at red or near infrared wavelengths. If there is suspended sediment present in the upper layers of the water body, then this will allow better reflectivity and a brighter appearance of the water. The apparent colour of the water will show a slight shift to longer wavelengths. Suspended sediment (S) can be easily confused with shallow (but clear) water, since these two phenomena appear very similar. Chlorophyll in algae absorbs more of the blue wavelengths and reflects the green, making the water appear greener in colour when algae is present. The topography of the water surface (rough, smooth, floating materials, etc.) can also lead to complications for water-related interpretation due to potential problems of specular reflection and other influences on colour and brightness.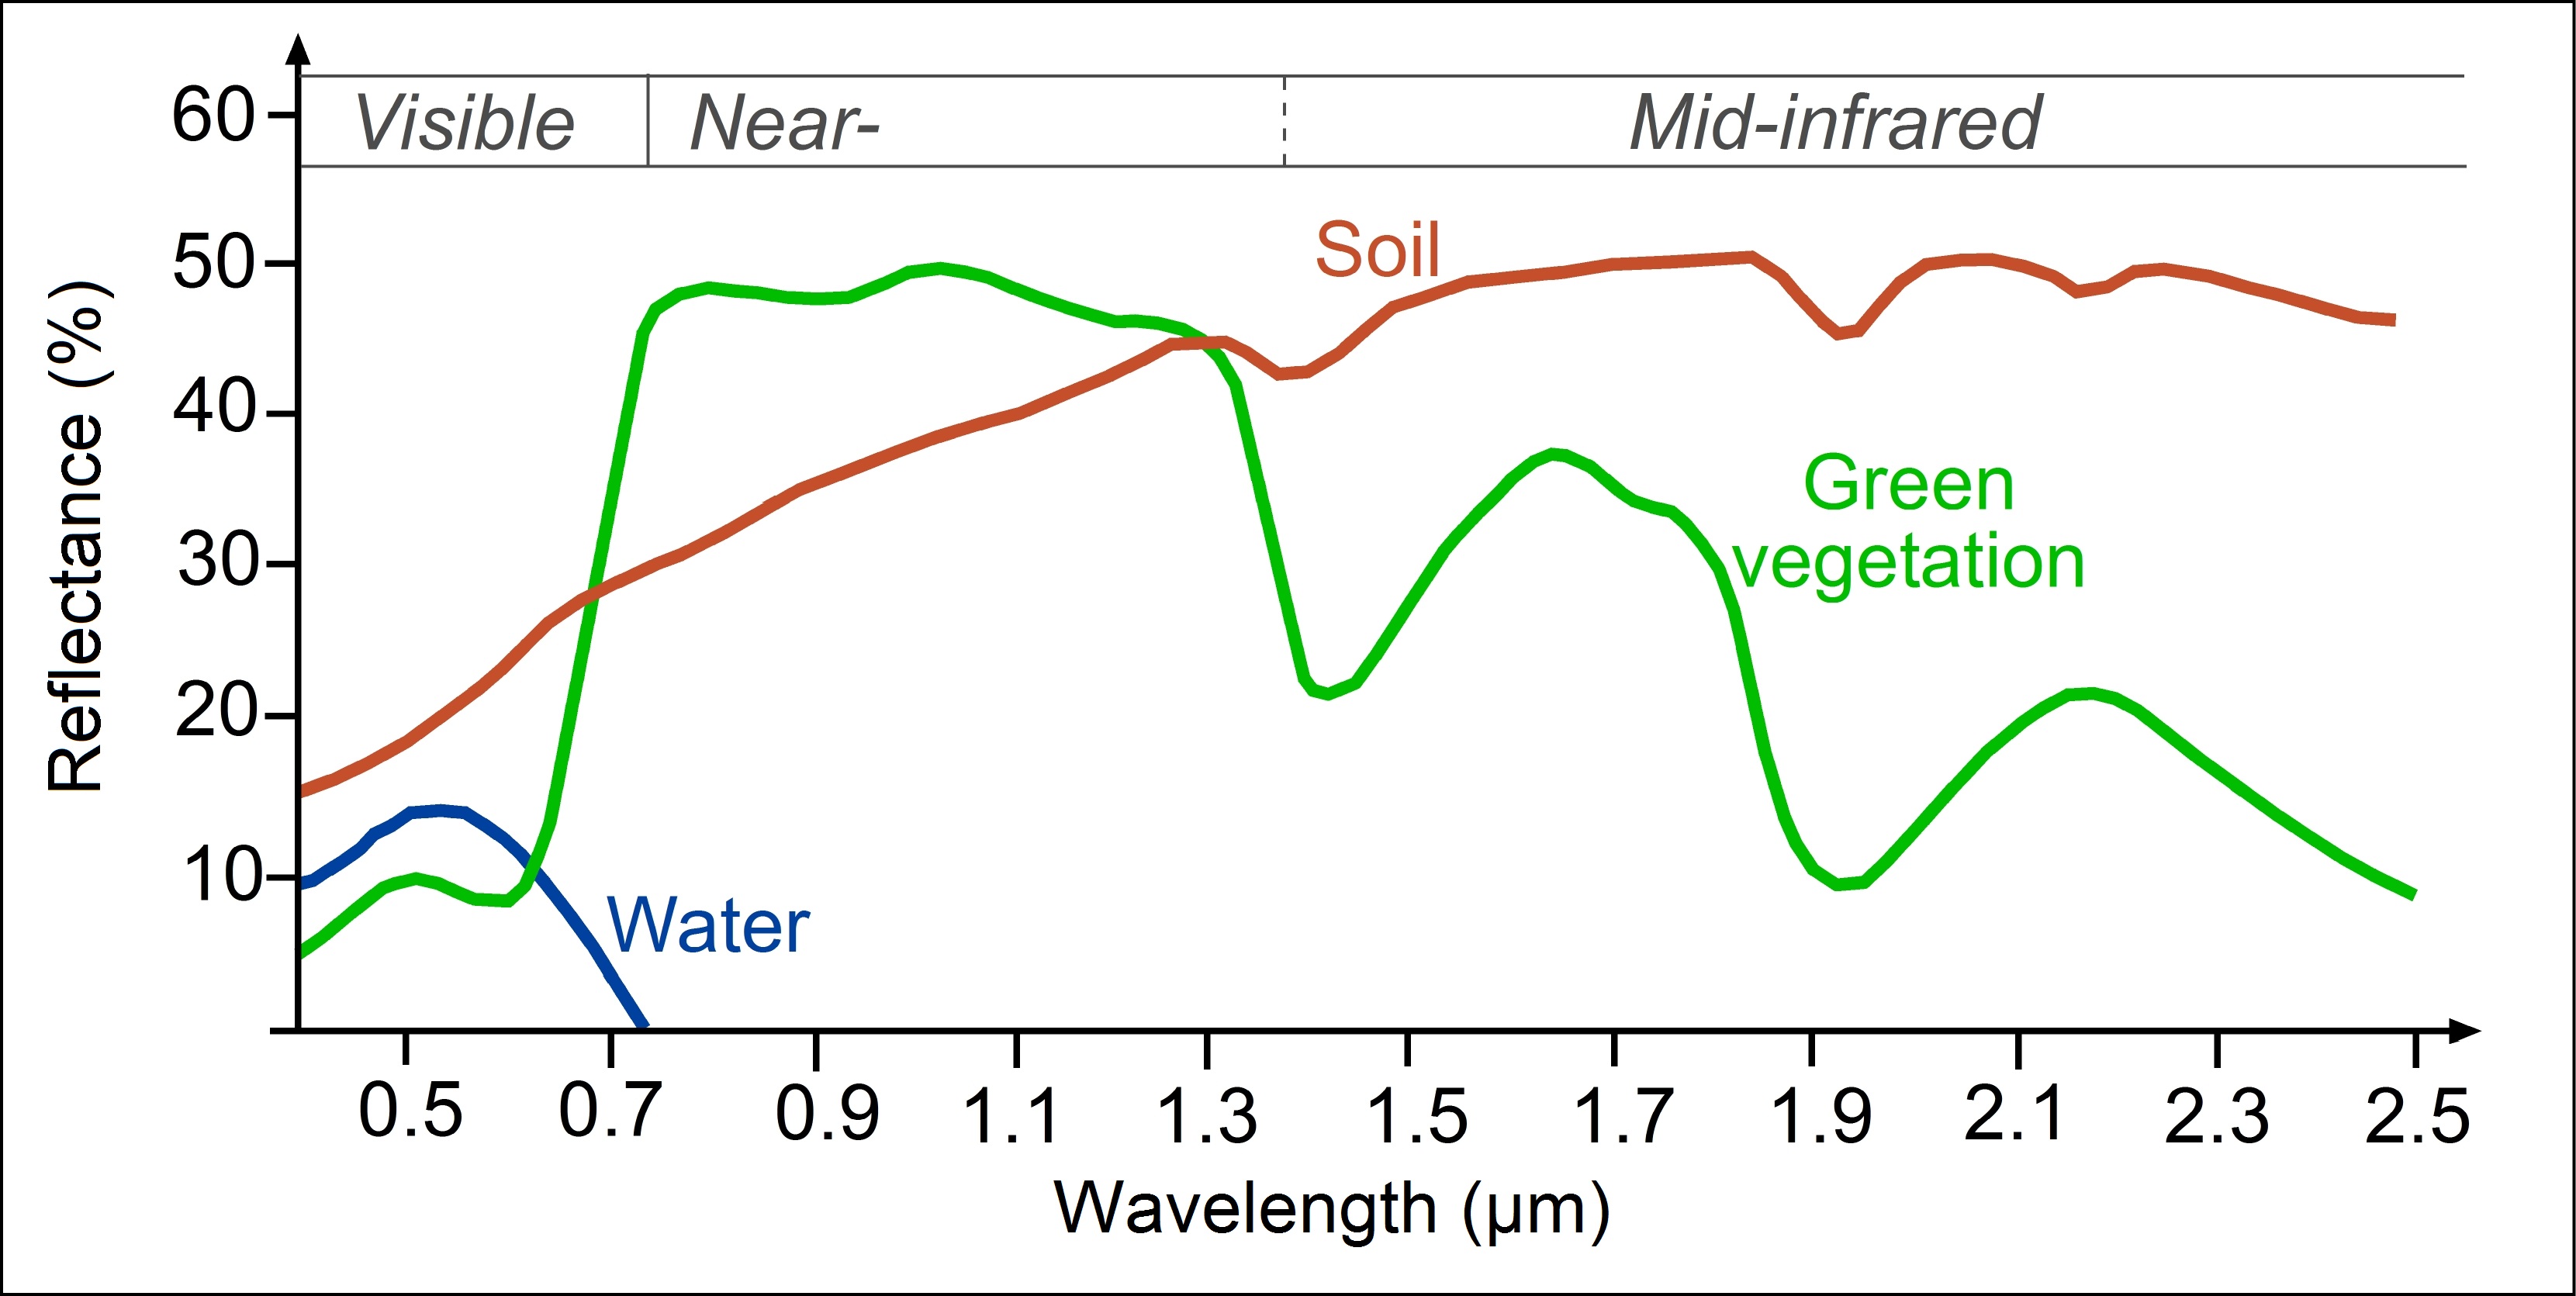
We can see from these examples that, depending on the complex make-up of the target that is being looked at, and the wavelengths of radiation involved, we can observe very different responses to the mechanisms of absorption, transmission, and reflection. By measuring the energy that is reflected (or emitted) by targets on the Earth’s surface over a variety of different wavelengths, we can build up a spectral response for that object. By comparing the response patterns of different features we may be able to distinguish between them, where we might not be able to, if we only compared them at one wavelength. For example, water and vegetation may reflect somewhat similarly in the visible wavelengths but are almost always separable in the infrared. Spectral response can be quite variable, even for the same target type, and can also vary with time (e.g. “green-ness” of leaves) and location. Knowing where to “look” spectrally and understanding the factors that influence the spectral response of the features of interest are critical to correctly interpreting the interaction of electromagnetic radiation with the surface.
2.4 Satellite images characteristics
Sensor
A sensor is a device that measures and records electromagnetic energy.
Sensors can be divided into two groups.
- Passive sensors depend on an external source of energy, usually the sun. Most of the satellite sensors are passive.
- Active sensors have their own source of energy, an example would be a radar gun. These sensors send out a signal and measure the amount reflected back. Active sensors are more controlled because they do not depend upon varying illumination conditions
Platforms
In order for a sensor to collect and record energy reflected or emitted from a target or surface, it must reside on a stable platform removed from earth’s surface being observed. Platforms for remote sensors may be situated on the ground, on an aircraft or balloon (or some other platform within the Earth’s atmosphere), or on a spacecraft or satellite outside of the Earth’s atmosphere.
Satellite Characteristics: Orbits and Swaths
Satellites have several unique characteristics which make them particularly useful for remote sensing of the Earth’s surface. The path followed by a satellite is referred to as its orbit. Satellite orbits are matched to the capability and objective of the sensor(s) they carry. Orbit selection can vary in terms of altitude (their height above the Earth’s surface) and their orientation and rotation relative to the Earth.
Geostationary Satellite
Satellites at very high altitudes, which view the same portion of the Earth’s surface at all times have geostationary orbits. These geostationary satellites revolve at speeds which match the rotation of the Earth so they seem stationary, relative to the Earth’s surface. This allows the satellites to observe and collect information continuously over specific areas. Weather and communications satellites commonly have these types of orbits. Due to their high altitude, some geostationary weather satellites can monitor weather and cloud patterns covering an entire hemisphere of the Earth.
Sun-synchronous Satellite
Many remote sensing platforms are designed to follow an orbit (basically north-south) which, in conjunction with the Earth’s rotation (west-east), allows them to cover most of the Earth’s surface over a certain period of time. These are nearpolar orbits, so named for the inclination of the orbit relative to a line running between the North and South poles. These satellite orbits are known as sun-synchronous.
Swath
As a satellite revolves around the Earth, the sensor “sees” a certain portion of the Earth’s surface. The area imaged on the surface, is referred to as the swath.
Imaging swaths for space borne sensors generally vary between tens and hundreds of kilometers wide. As the satellite orbits the Earth from pole to pole, its east-west position wouldn’t change if the Earth didn’t rotate.
However, as seen from the Earth, it seems that the satellite is shifting westward because the Earth is rotating (from west to east) beneath it. This apparent movement allows the satellite swath to cover a new area with each consecutive pass. The satellite’s orbit and the rotation of the Earth work together to allow complete coverage of the Earth’s surface, after it has completed one complete cycle of orbits.
Satellite Image data characteristics
Remote sensing data characteristics play a crucial role in determining the quality and applicability of the acquired information. These characteristics encompass image resolution, spectral bands, spatial resolution, and temporal resolution. Here’s an overview of each:
1. Spectral Bands
- Remote sensing sensors are equipped with multiple spectral bands, each sensitive to specific ranges of electromagnetic radiation (wavelengths).
- Different materials and features on the Earth’s surface have unique spectral signatures, allowing their identification and differentiation.
2. Spatial Resolution
- Spatial resolution refers to the level of detail in terms of the size of individual pixels in an image.
- High spatial resolution images have smaller pixels, capturing finer details, but covering a smaller area.
- Low spatial resolution images have larger pixels, offering a broader coverage but with less detail.
3. Temporal Resolution
- Temporal resolution indicates how frequently images are acquired over a specific area.
- Frequent revisits are critical for monitoring dynamic changes over time, such as urban growth, vegetation health, or natural disasters.
4. Radiometric Resolution
- Radiometric resolution refers to the ability of a sensor to distinguish between different levels of brightness (radiometric values) in an image.
https://youtu.be/XR8wF_To24g?si=ic9KaCAEiVDdocLf
3.1 Applications of Remote Sensing in Terrain Analysis
Terrain analysis is the process of systematically studying and evaluating the physical characteristics of the Earth’s surface, including its topography, geology, hydrology, and vegetation. It plays a crucial role in various fields, including geography, geology, environmental science, urban planning, and military studies. Terrain analysis aims to understand and describe the features and attributes of a specific area or region.
3.2 Significance of terrain analysis in military studies
Remote sensing technology plays a vital role in terrain analysis for military studies, providing critical information that helps military planners and decision-makers understand and navigate complex landscapes. Here are some key applications of remote sensing in terrain analysis for military purposes:
- Topographic Mapping: Remote sensing can provide high-resolution elevation data, which is essential for creating accurate topographic maps. These maps are crucial for route planning, identifying key terrain features, and understanding the overall geography of an area of interest.
- Terrain Classification: Remote sensing imagery, including satellite and aerial imagery, can be used to classify terrain types. This information helps military planners assess the suitability of terrain for various operations, such as infantry movements, vehicle deployment, or artillery positioning.
- Obstacle Detection: Remote sensing sensors, such as LIDAR and SAR (Synthetic Aperture Radar), can detect natural and man-made obstacles, such as vegetation, buildings, and water bodies. Identifying obstacles helps in planning routes and avoiding potential hazards during military movements.
- Visibility Analysis: Remote sensing data can be used to calculate line-of-sight visibility across the terrain. This analysis is critical for identifying positions with good observation points or cover and concealment options.
- Hydrological Analysis: Terrain analysis helps in understanding the flow of water across the landscape. It is used for delineating watersheds, identifying drainage patterns, and assessing the potential for flooding and erosion. Hydrological models are often employed to simulate water movement in different terrains.
- Geological Analysis: Terrain analysis is used to identify and characterize geological features such as rock formations, faults, and mineral deposits. This information is valuable in geologic surveys, resource exploration, and environmental assessments.
- Route Planning: Remote sensing data can be used to identify optimal routes for military movements, considering factors like terrain, road networks, and potential obstacles. This is critical for mission planning and logistics.
Overall, remote sensing technology enhances the ability of military forces to analyze terrain effectively, plan operations, and respond to changing conditions in a dynamic battlefield environment. It contributes to improved situational awareness and informed decision-making, ultimately enhancing the success and safety of military missions.
3.3 Use of Google Earth & Google Earth Engine in Terrain Analysis.
Here are some specific data sources available in Google Earth Engine (GEE) that are relevant for 3D terrain analysis:
- Digital Elevation Models (DEMs):
- Shuttle Radar Topography Mission (SRTM) DEM: Provides elevation data with global coverage at 1 arc-second (approximately 30 meters) resolution.
- Advanced Spaceborne Thermal Emission and Reflection Radiometer (ASTER) GDEM: Offers high-resolution DEMs with global coverage at 30 meters resolution.
- TanDEM-X DEM: Provides very high-resolution elevation data for select areas.
- Terrain Slope and Aspect Data:
- Slope and aspect layers derived from DEMs: GEE allows users to calculate slope and aspect from DEM data, which are crucial for understanding terrain steepness and directionality.
- Viewshed Analysis:
- GEE supports the calculation of viewsheds, allowing you to determine what parts of the terrain are visible from specific observation points. This is essential for tactical planning and surveillance.
These data sources and analysis capabilities in Google Earth Engine are valuable for conducting 3D terrain analysis, including slope analysis, line-of-sight visibility assessments, and other terrain-related studies
Chapter 4: Environmental Monitoring Using Remote Sensing Techniques
4.1 Land use/land cover
Land use and land cover (LULC) refer to the physical and functional characteristics of the Earth’s surface, including the ways in which humans utilize and manage land resources. Land use describes how land is utilized for specific human activities, such as residential, commercial, agricultural, industrial, or recreational purposes. Land cover, on the other hand, focuses on the types of natural and artificial features present on the Earth’s surface, such as forests, water bodies, urban areas, croplands, and barren land.
Classes of Land Use/Land Cover
LULC is often categorized into various classes to represent different features and activities. These classes provide a standardized way to classify and analyze the Earth’s surface. The specific classes can vary depending on the classification system used and the objectives of the analysis.
Sentinel satellites, operated by the European Space Agency (ESA), provide data that can be used for land use and land cover classification. The Sentinel-2 satellites, in particular, are known for their high-resolution multispectral imagery, which is valuable for monitoring changes in land use and land cover over time. The data from Sentinel-2 satellites can be used to classify various land use and land cover classes.
Here are some common land use and land cover classes that can be identified and classified using Sentinel satellite data:
- Urban Areas: This class includes cities, towns, and other developed areas characterized by a high density of buildings, roads, and infrastructure.
- Agricultural Land: This class encompasses areas used for farming, including croplands, orchards, vineyards, and other cultivated areas.
- Forest and Woodland: This class includes areas covered by forests and wooded landscapes, which can be further categorized based on tree type and density.
- Grassland and Pasture: These areas are characterized by the presence of grasses and are often used for grazing livestock.
- Water Bodies: This class includes rivers, lakes, reservoirs, and other bodies of water.
- Wetlands: Wetlands consist of areas with a high-water table or areas that are periodically flooded, such as swamps, marshes, and bogs.
- Bare Soil and Desert: These areas have minimal vegetation cover and are often characterized by exposed soil, sand, or rock.
- Snow and Ice: This class includes regions covered by snow and ice, typically found in polar regions and at high elevations.
- Built-up Areas: This subclass of the urban class focuses specifically on areas with dense human-made structures.
- Crops and Plantations: This subclass of agricultural land focuses on specific types of crops, such as large plantations of a single crop.
- Shrubland: These areas are characterized by low, woody vegetation, often found in semi-arid regions.
- Bodies of Water (Inland): This subclass of water bodies focuses specifically on inland water features, such as lakes and reservoirs.
- Bodies of Water (Coastal): This subclass of water bodies focuses on coastal areas, including shorelines and estuaries.
- Glaciers: This subclass of snow and ice class specifically refers to large masses of ice formed from the accumulation and compaction of snow.
Use of Google Earth Engine (GEE) for Land use and land classes Data Analysis
In Google Earth Engine (GEE), you have access to a wide range of data sources that can be used for land use and land cover (LULC) analysis. These data sources include satellite imagery, remote sensing datasets, and various derived products. Here are some commonly used data sources and their characteristics in GEE for land use and land cover analysis:
- Landsat Images:
- Landsat 5, 7, and 8 satellite imagery is available in GEE.
- Spatial Resolution: 30 meters (Landsat 5, 7), 15 meters (Landsat 8 panchromatic), 30 meters (Landsat 8 multispectral).
- Temporal Resolution: Landsat satellites revisit approximately every 16 days.
- Sentinel-2 Images:
- Sentinel-2A and 2B satellite imagery is available.
- Spatial Resolution: 10 meters, 20 meters, and 60 meters.
- Temporal Resolution: Sentinel-2A and 2B combined provide a 5-day revisit interval.
- MODIS Images:
- Moderate Resolution Imaging Spectroradiometer (MODIS) data is available for various products like land surface temperature, vegetation indices, and land cover dynamics.
- Spatial Resolution: Varies from 250 meters to 1 kilometer.
- Temporal Resolution: Daily revisits.
- NLCD (National Land Cover Database):
- NLCD data for the United States provides detailed land cover and land use information.
- Spatial Resolution: 30 meters.
- Temporal Resolution: Available for different years.
- Hansen Global Forest Change Dataset:
- Provides data on global forest cover and change over time.
- Spatial Resolution: 30 meters.
- Temporal Resolution: Available for different years.
- Global Urban Footprint:
- Provides information about urban extent and land cover.
- Spatial Resolution: 12 meters.
- Temporal Resolution: Varies by dataset.
- Global Cropland Data:
- Datasets like Global Agriculture Monitoring (GLAM) provide cropland extent and crop type information.
- Spatial Resolution: Varies by dataset.
- Temporal Resolution: Varies by dataset.
- Land Cover Classification Products:
- Pre-classified land cover datasets like Copernicus Global Land Cover can be used for analysis.
- Spatial Resolution: Varies by dataset.
- Temporal Resolution: Varies by dataset.
- Vegetation Indices:
- Derived from satellite imagery, various vegetation indices like NDVI, EVI, and SAVI are available for analysing vegetation health and cover.
Characteristics of these data sources include spatial and temporal resolutions, availability of historical data, spectral bands, and thematic accuracy. In GEE, you can use these data sources along with the platform’s analysis capabilities to perform land use and land cover classification, change detection, time-series analysis, and more. Keep in mind that the choice of data source depends on your specific analysis goals and the geographic area of interest.
Landuse & Landcover – 2017 – 2022
![]()
NDVI Time Series – Click at Nigeria Map
4.2 Climate
Climate refers to the long-term patterns of temperature, humidity, wind, precipitation, and other atmospheric conditions in a specific region over extended periods, typically spanning decades to centuries. It encompasses the interactions between various components of the Earth’s atmosphere, oceans, land surfaces, and ice.
In the context of Policy and Strategic Studies, climate holds significant importance due to its far-reaching impacts on various aspects of human society, the environment, and economies.
Climate variables
“Climate variables” in the context of Military Studies generally refer to the key factors and metrics related to climate change that inform policy decisions and strategic planning. These variables help strategists understand the current and projected impacts of climate change, as well as the effectiveness of various mitigation and adaptation strategies. Here are some important climate variables relevant to military Studies:
- Temperature: Monitoring changes in global and regional temperatures is crucial for understanding the extent of climate change. Rising temperatures can have various impacts on ecosystems, agriculture, water resources, and human health.
- Precipitation Patterns: Changes in precipitation patterns, including shifts in rainfall intensity and distribution, affect water availability, agriculture, and the frequency of extreme weather events like floods and droughts.
- Sea Level Rise: Sea level rise is a critical variable, especially for coastal regions. Rising sea levels can lead to saltwater intrusion, erosion, and increased vulnerability to storm surges.
- Extreme Weather Events: Tracking the frequency and intensity of extreme weather events such as hurricanes, heatwaves, and wildfires is crucial for understanding climate-related risks and planning disaster response strategies.
- Glacial Retreat and Ice Melt: Changes in glacial and polar ice contribute to sea level rise and can have global implications. Monitoring ice melt helps assess the rate of change in these regions.
- Ocean Acidification: Increasing carbon dioxide levels in the atmosphere also lead to higher CO2 levels in the oceans, causing ocean acidification. This can have significant impacts on marine ecosystems, including coral reefs and shellfish.
- Biodiversity Loss: Climate change affects ecosystems and biodiversity, leading to shifts in species distribution and potential extinctions. Monitoring biodiversity changes informs conservation efforts.
- Carbon Dioxide (CO2) Levels: Rising atmospheric CO2 levels are a primary driver of climate change. Monitoring CO2 concentrations helps assess the progress of emissions reduction efforts.
- Methane and Other Greenhouse Gases: Besides CO2, other greenhouse gases like methane (CH4) play a significant role in climate change. Monitoring these gases is important for comprehensive emissions management.
- Land Use Changes: Changes in land cover, such as deforestation and urbanization, contribute to climate change. Monitoring land use helps identify areas where policies can be implemented to mitigate impacts.
- Energy Consumption and Emissions: Tracking energy consumption and greenhouse gas emissions by sectors (such as transportation, industry, and agriculture) helps guide policies aimed at reducing emissions.
- Climate Models and Projections: Climate models use current data to project future climate scenarios. These models are crucial for assessing potential impacts and developing long-term policy strategies.
- Social and Economic Impacts: Understanding how climate change affects social systems, economies, and vulnerable populations informs policies focused on adaptation and resilience.
- International Agreements and Commitments: Monitoring the progress of international agreements (e.g., Paris Agreement) and commitments made by countries to reduce emissions and address climate change is crucial for global coordination.
These climate variables are essential for policymakers and strategists to develop effective policies and strategies to address climate change’s challenges and opportunities. They provide the basis for informed decision-making and for prioritizing actions to mitigate and adapt to the impacts of a changing climate.
Use of Google Earth Engine (GEE) for Climate Data Analysis
Google Earth Engine (GEE) is a powerful platform that allows users to access and analyze a wide range of geospatial data, including climate-related variables. GEE provides a vast collection of datasets that can be used to study various climate parameters and trends. Here are some examples of climate variables that you can access and analyze using Google Earth Engine:
- Temperature Data:
- Land Surface Temperature (LST): This data provides information about the temperature of the Earth’s surface.
- Sea Surface Temperature (SST): SST data is crucial for understanding oceanic climate patterns.
- Precipitation Data:
- Precipitation: Various datasets offer information on precipitation patterns, which are vital for studying water availability and climate-related risks.
- Evapotranspiration:
- Evapotranspiration (ET): ET data helps assess the amount of water vapor returned to the atmosphere through evaporation and plant transpiration.
- Climate Reanalysis Data:
- Climate reanalysis datasets provide a comprehensive view of past climate conditions, including variables like temperature, precipitation, wind patterns, and more.
- Wind Speed and Direction:
- Wind vectors: These datasets provide information about wind speed and direction, important for understanding atmospheric circulation patterns.
- Humidity:
- Relative Humidity: Humidity data helps in assessing moisture content in the atmosphere.
- Solar Radiation:
- Incoming Solar Radiation: This data is crucial for understanding energy balance and climate patterns.
- Sea Level Anomalies:
- Sea level anomaly datasets help track variations in sea level, providing insights into oceanic and climate dynamics.
- Drought Indices:
- Drought indices like the Standardized Precipitation Index (SPI) and Palmer Drought Severity Index (PDSI) can help monitor drought conditions.
- Fire and Burn Area Data:
- Data on fire occurrences and burn areas can be used to study the impact of climate on wildfire patterns.
These are just a few examples of the climate-related variables you can access and analyze using Google Earth Engine. The platform offers a wide range of datasets from various sources, including satellite observations and climate models. You can use the GEE Code Editor to write scripts and perform analyses on these variables, enabling you to study climate trends, assess impacts, and make informed decisions related to climate change and environmental management.
In Google Earth Engine (GEE), you can access a variety of climate-related data sources that provide information on temperature, precipitation, and other climate variables. These datasets are valuable for analysing climate patterns, trends, and impacts. Here are some climate data sources available in GEE along with their characteristics:
- Climate Hazards Group InfraRed Precipitation with Station data (CHIRPS):
- Characteristics: High-resolution precipitation data based on satellite observations and ground station data.
- Temporal Resolution: Daily.
- Spatial Resolution: Approximately 5 km.
- Tropical Rainfall Measuring Mission (TRMM):
- Characteristics: Precipitation data from TRMM satellite observations.
- Temporal Resolution: Various time intervals (e.g., 3-hourly, monthly).
- Spatial Resolution: Varies based on product.
- Climate Prediction Center (CPC) Unified Precipitation:
- Characteristics: Global precipitation data provided by the CPC.
- Temporal Resolution: Daily.
- Spatial Resolution: Approximately 0.25 degrees.
- Climate Prediction Center (CPC) Temperature:
- Characteristics: Global temperature data provided by the CPC.
- Temporal Resolution: Daily.
- Spatial Resolution: Approximately 0.5 degrees.
- MODIS Land Surface Temperature (LST):
- Characteristics: Land surface temperature data derived from MODIS satellite observations.
- Temporal Resolution: Daily.
- Spatial Resolution: Varies (approximately 1 km).
- Global Precipitation Climatology Centre (GPCC) Full Data Reanalysis Version 7:
- Characteristics: Gridded global precipitation data from rain gauges and other sources.
- Temporal Resolution: Monthly.
- Spatial Resolution: 0.5 degrees.
- Climate Research Unit (CRU) TS4.04:
- Characteristics: Global climate dataset with temperature and precipitation variables.
- Temporal Resolution: Monthly.
- Spatial Resolution: 0.5 degrees.
- ERA5 Climate Data Assimilation System:
- Characteristics: Reanalysis dataset from the European Centre for Medium-Range Weather Forecasts (ECMWF).
- Temporal Resolution: Hourly, daily, monthly.
- Spatial Resolution: Various resolutions (e.g., 0.25 degrees).
- Daymet: Daily Surface Weather Data on a 1-km Grid for North America:
- Characteristics: High-resolution daily weather data for North America.
- Temporal Resolution: Daily.
- Spatial Resolution: Approximately 1 km.
These datasets provide valuable information for analyzing climate patterns, trends, and variability. When using these data sources in GEE, consider the specific climate variable you’re interested in, the geographic area of interest, and the desired temporal and spatial resolutions. GEE’s processing capabilities allow you to perform various analyses, visualize trends, and gain insights into climate-related patterns and impacts.
Sum of Pentad Precipitation – 1980-2022 – Click at Nigeria Map
Mean Monthly Temperature – 2015 – 2022 – Click at Nigeria Map
5.1 Human Population and Settlements
Definitions
Human Population refers to the total number of people living in a specific geographic area, such as a city, country, or the entire world. It is a fundamental demographic variable that represents the size of a community or society. Human population is influenced by birth rates, death rates, immigration, and emigration, and it plays a significant role in shaping various social, economic, and environmental dynamics.
Settlements refer to places where people live, work, and carry out various activities. Settlements range from small rural villages to large cities. They include residential areas, commercial districts, industrial zones, and infrastructure such as roads, schools, and hospitals.
Significance in Military Studies:
The study of human population and settlements is significant in military studies for several reasons, as it provides valuable information and insights that can influence military strategy, tactics, and decision-making. Here are some key aspects of why human population and settlements studies are important in the context of military:
- Demographic Data and Analysis: Understanding the demographics of a region, including population size, age distribution, ethnic composition, and population growth rates, is crucial for military planners. Demographic data can help predict potential sources of recruits or support for insurgent groups, assess the stability of local governments, and estimate the humanitarian and logistical needs of a population during military operations.
- Social and Cultural Dynamics: An in-depth knowledge of the social and cultural dynamics of a population is essential for effective military engagement. It helps military personnel to interact with local communities more effectively, gain their trust, and avoid cultural misunderstandings or unintentional offenses. This understanding is particularly important in counterinsurgency operations and stability missions.
- Civilian Protection and Minimizing Collateral Damage: Military operations often take place in or near populated areas. Understanding settlement patterns and the location of civilian populations is crucial for minimizing civilian casualties and collateral damage during conflicts. This knowledge informs rules of engagement and target selection to protect non-combatants.
- Infrastructure and Logistics: Population studies help identify key infrastructure, such as transportation networks, critical facilities, and supply routes. Military forces can use this information to prioritize targets for disruption or protection. Additionally, understanding settlement patterns can aid in planning logistical support for military operations.
- Psychological Operations (PsyOps): Knowledge of local populations’ beliefs, values, and attitudes can be leveraged in psychological operations to influence public opinion, build trust, and counter propaganda from hostile actors. Effective PsyOps can help win hearts and minds and gain local support.
- Urban Warfare and Counterinsurgency: As the world becomes increasingly urbanized, military forces often find themselves operating in complex urban environments. The study of settlements is essential for urban warfare strategies and tactics, as it provides insights into building layouts, potential ambush sites, and civilian population movements.
- Humanitarian Assistance and Disaster Relief: Military forces are often called upon to provide humanitarian assistance and disaster relief in the aftermath of natural disasters or during humanitarian crises. Understanding settlement patterns and population needs is crucial for effective response and relief efforts.
- Counterterrorism: In counterterrorism operations, knowledge of population centers, recruitment hubs, and areas of radicalization is critical. Identifying areas where terrorist organizations may have strongholds or sympathizers helps in targeting and disrupting their activities.
- Border and Area Control: For border security and area control, understanding settlement patterns along borders and in contested regions is essential. This information helps in developing border security strategies and allocating resources effectively.
- Strategic Planning: Population studies can inform long-term military strategies and geopolitical assessments. Understanding demographic trends, migration patterns, and the distribution of potential adversaries can shape military policy and resource allocation.
In summary, human population and settlements studies are valuable in military studies because they provide critical insights into the human terrain, enabling military forces to operate more effectively, protect civilians, and achieve their strategic objectives while minimizing negative impacts on local populations.
Use of Google Earth Engine (GEE) for human population and settlements analysis.
Google Earth Engine (GEE) offers various data sources and tools to analyse human population and settlements. Here are some data sources and characteristics related to human population and settlements in GEE:
- Gridded Population of the World (GPW):
- Characteristics: High-resolution global population data, available in different versions (e.g., GPWv4, GPWv4.11).
- Spatial Resolution: Varies (e.g., 30 arc-seconds, 2.5 arc-minutes).
- Temporal Resolution: Usually available for multiple years.
- Image ID Example: ‘JRC/GHSL/P2016/POP_GPW_GLOBE_V1/2015’.
- Global Human Settlement Layer (GHSL):
- Characteristics: Provides information on built-up areas and population distribution.
- Spatial Resolution: 38 meters.
- Temporal Resolution: Available for different years.
- Image ID Example: ‘JRC/GHSL/P2016/BUILT_LDSMT_GLOBE_V1’.
- World Settlement Footprint (WSF):
- Characteristics: Global dataset depicting built-up areas and settlement extents.
- Spatial Resolution: 10 meters.
- Temporal Resolution: Usually available for multiple years.
- Image ID Example: ‘ESA/GLOBCOVER_L4_200901_200912_V2_3’.
- LandScan Global Population Database:
- Characteristics: Provides gridded population estimates at a high spatial resolution.
- Spatial Resolution: Approximately 1 km.
- Temporal Resolution: Available for different years.
- Image ID Example: ‘NASA/SEDAC/LANDSCAN/2018’.
- High Resolution Settlement Layer (HRSL):
- Characteristics: Offers high-resolution data on human settlements.
- Spatial Resolution: 30 meters.
- Temporal Resolution: Usually available for multiple years.
- Image ID Example: ‘WRI/GHS/HRS_POP_GPW_GLOBE_V1’.
- Urban Atlas Data:
- Characteristics: Provides detailed information on urban areas across Europe.
- Spatial Resolution: Varies (e.g., 2.5 meters, 25 meters).
- Temporal Resolution: Available for different years.
- Image ID Example: ‘COPERNICUS/Land_Use/Urban_Atlas/2012’.
These datasets offer insights into human population distribution, urbanization, and settlement patterns. They are valuable for understanding demographic trends, planning infrastructure, and assessing the impact of urban growth on the environment. When using these datasets in GEE, you can analyze and visualize changes in population density, urban expansion, and settlement dynamics over time
Estimated Residential Population per 100x100m Grid Square
5.2 Human DevelopmentDefinitions
Human Development refers to the process of improving the well-being, capabilities, and quality of life of individuals and communities. It encompasses factors beyond economic growth and income, taking into account aspects such as education, healthcare, access to basic services, social inclusion, and individual empowerment. The concept of human development emphasizes that development should be centered on people and their capabilities, rather than solely focusing on economic indicators.
Significance in Military Studies:
The field of Human Development studies, which encompasses various aspects of human well-being and progress, is significant in military studies for several reasons. Understanding human development can have a profound impact on military strategy, operations, and decision-making. Here are some key reasons why Human Development studies are relevant in the context of military studies:
- Stability and Conflict Prevention: Improved human development indicators, such as access to education, healthcare, and economic opportunities, are often associated with greater stability and reduced likelihood of conflict. Understanding the factors that contribute to or hinder human development can help military planners identify regions at risk of instability and implement measures to prevent conflict.
- Conflict Resolution and Peacekeeping: In peacekeeping and conflict resolution missions, military forces may be tasked with facilitating negotiations and rebuilding post-conflict societies. Knowledge of human development can inform efforts to rebuild infrastructure, restore essential services, and promote reconciliation among conflicting groups.
- Civil-Military Relations: A strong understanding of human development can enhance civil-military relations. Military forces working in cooperation with civilian agencies and NGOs can better address the developmental needs of local populations, which can contribute to improved relations and cooperation with the host nation.
- Counterinsurgency and Counterterrorism: Addressing the root causes of insurgencies and terrorism often requires addressing the grievances and socioeconomic disparities that drive individuals to join such movements. Human Development studies can help identify these factors and inform strategies to counter radicalization and extremism.
- Humanitarian Assistance and Disaster Relief: Human Development studies can guide military forces in providing effective humanitarian assistance and disaster relief. This includes understanding the health, nutrition, and shelter needs of affected populations and coordinating with humanitarian agencies to deliver aid efficiently.
- Public Health and Biosecurity: In cases involving pandemics or biological threats, military forces may play a role in public health and biosecurity efforts. Understanding human development can inform strategies for managing public health crises, distributing medical supplies, and providing healthcare services.
- Resource Allocation: Military budgets are often substantial, and understanding human development can help military leaders make informed decisions about resource allocation. For example, investing in education and healthcare infrastructure may have long-term benefits for national security by promoting stability and reducing the potential for conflict.
- Crisis Response: In situations of national crisis or emergencies, such as natural disasters or public health crises, military forces may be called upon to provide support. Knowledge of human development indicators can help prioritize response efforts and allocate resources effectively.
- Migration and Refugee Crises: Understanding the factors that drive migration and refugee crises, including issues related to human development, can be essential for managing border security, humanitarian assistance, and addressing the root causes of displacement.
- Strategic Planning: Human Development studies can inform long-term military strategy by considering demographic trends, education levels, and other human development factors in assessing potential future challenges and opportunities.
In summary, Human Development studies are significant in military studies because they provide insights into the social, economic, and political factors that influence conflicts, stability, and the well-being of populations. Incorporating this knowledge into military planning and operations can lead to more effective and sustainable outcomes, ultimately contributing to national security and global peacekeeping efforts.
Night Light Data – Click at Nigeria Map